Inside Octri Monitoring: Observability for the SDKs You Ship
The SDKs you hand to other developers are the least-observed code you ship. Octri Monitoring watches them: de-minified stack traces tagged to a release, grouped issues, traces, performance, alerts, and a live tail. Included on every plan.
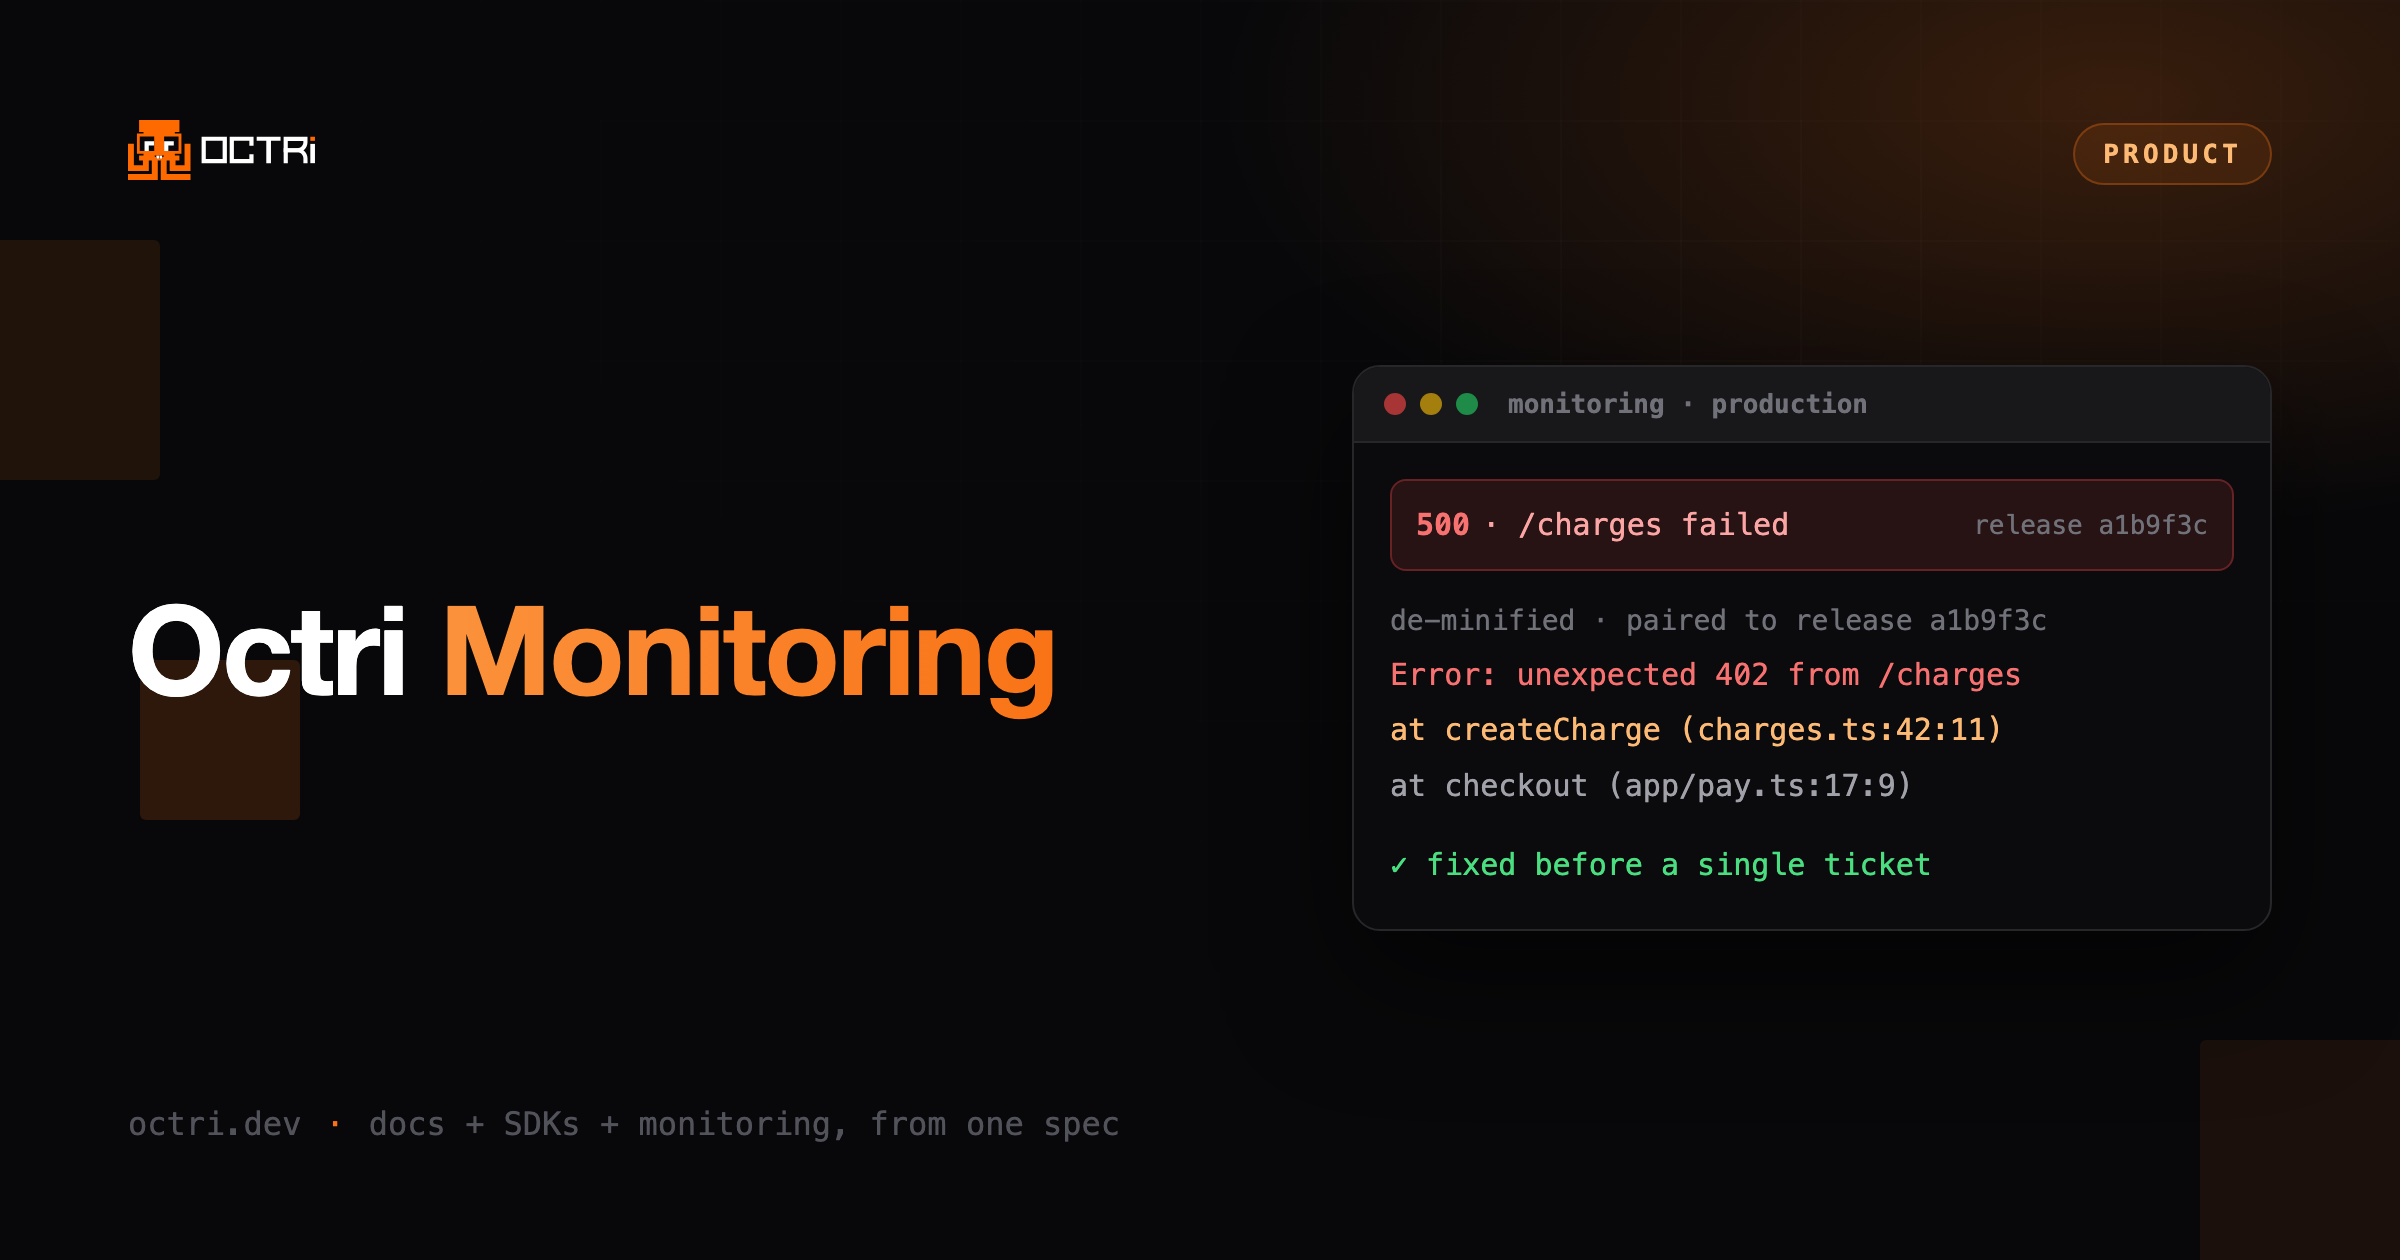
Think about where your code runs that you cannot see. Your servers are instrumented. Your own front end is wrapped in Sentry. The SDKs you generate and hand to other developers run inside their apps, in production, and you get nothing back. They are the most important surface of an API product and the least observed.
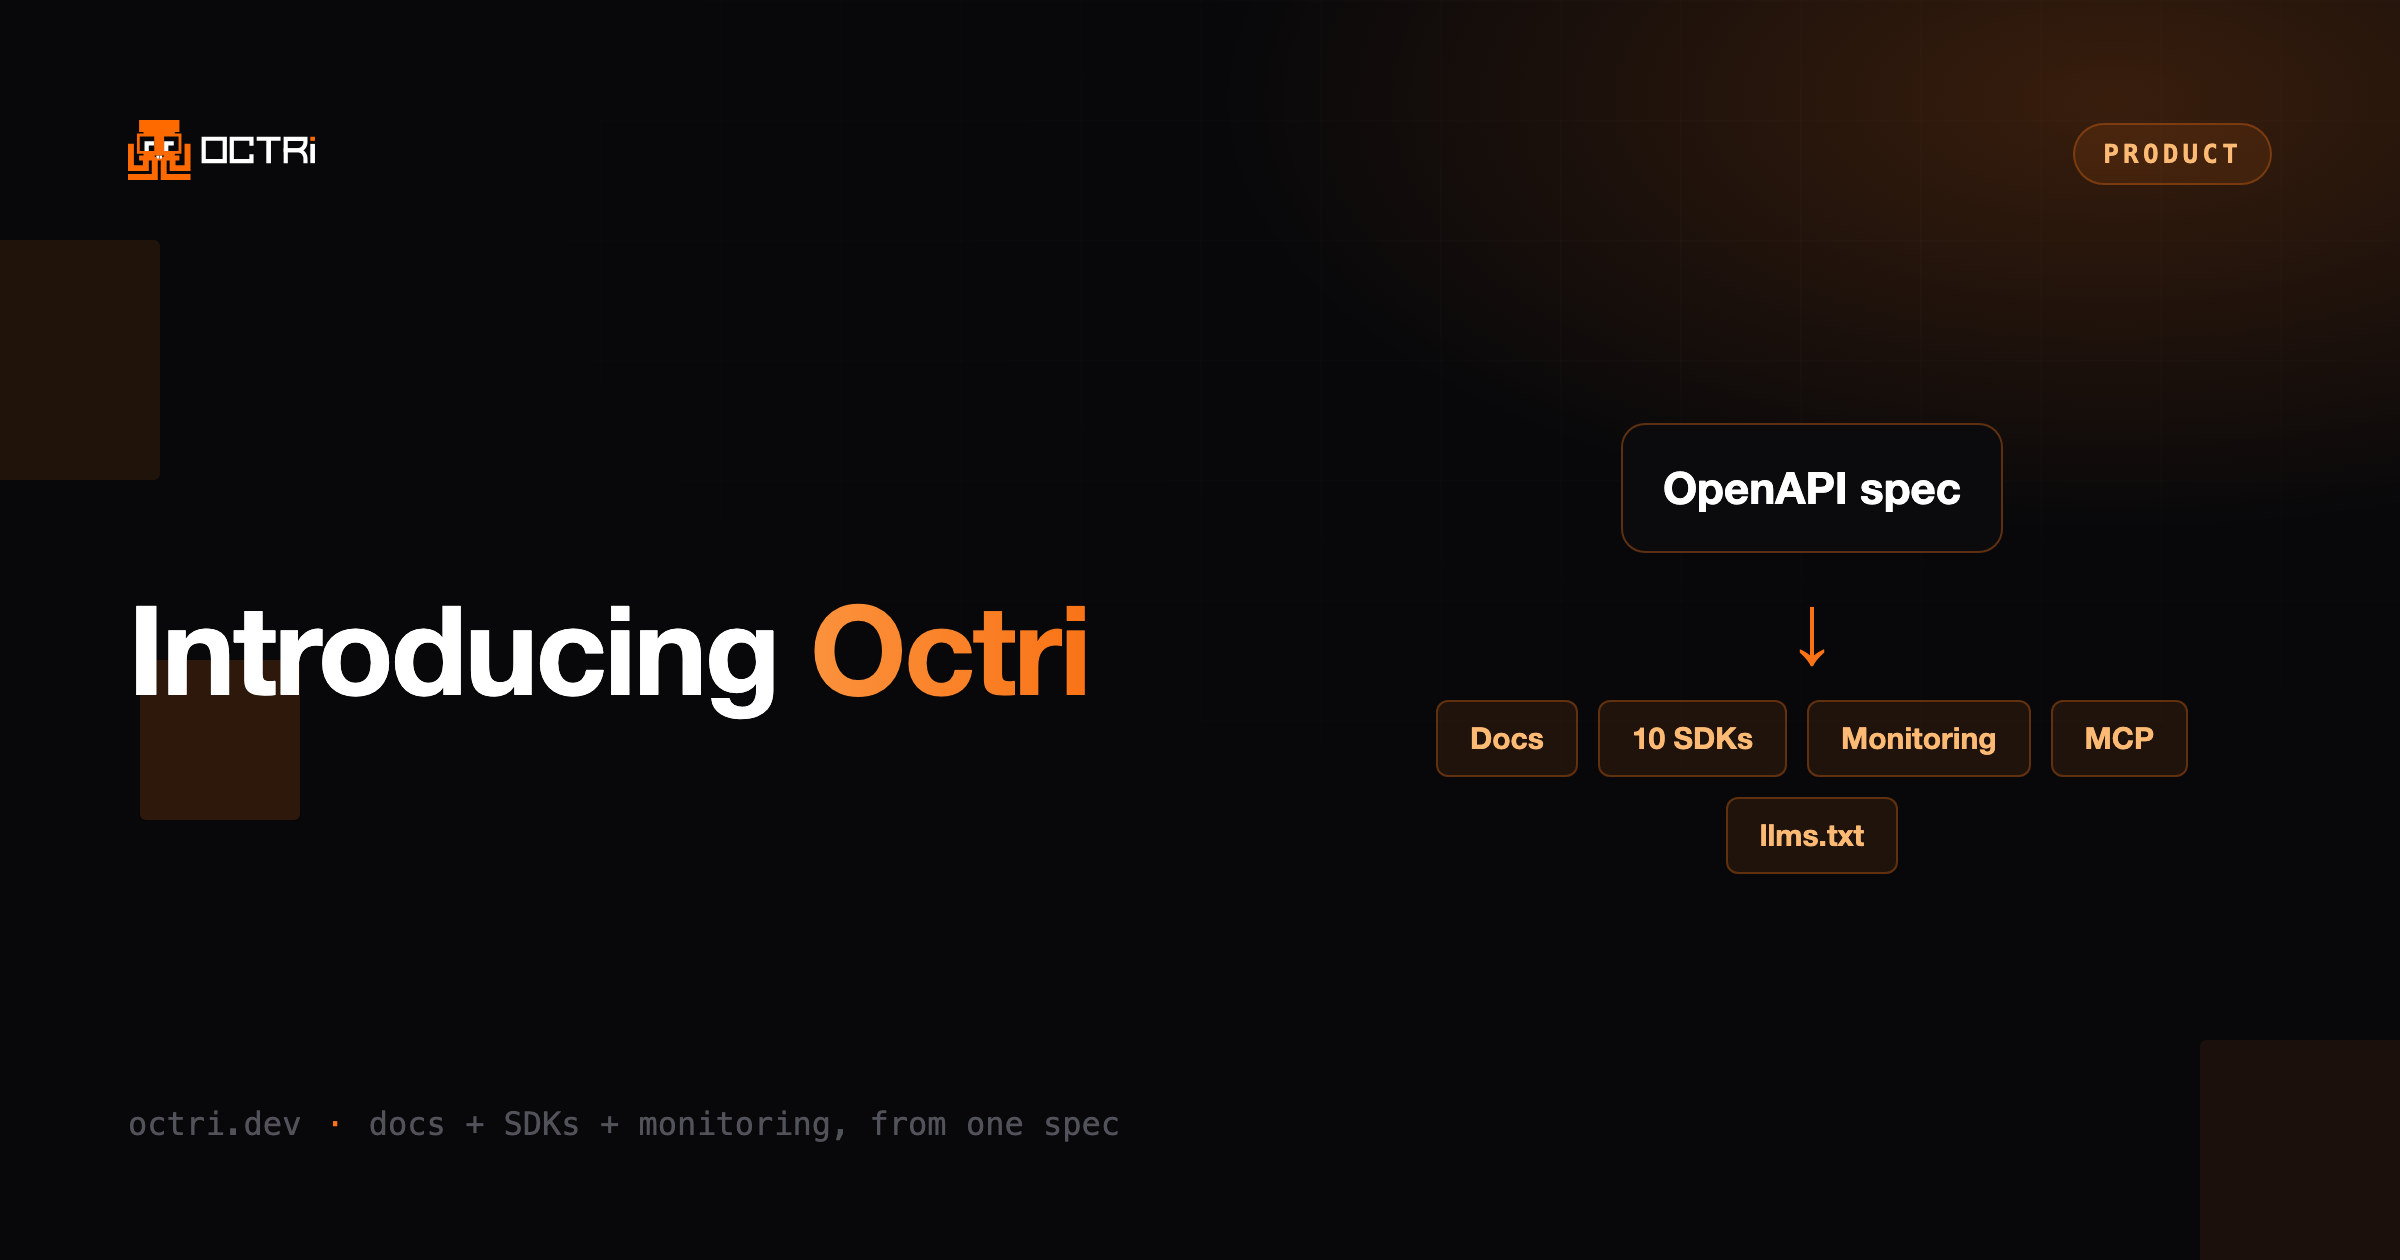
Octri Monitoring exists to close that gap. Because Octri generates the SDK, it can build the reporting straight into it. Every SDK can capture its own runtime errors and send them back with context: the endpoint, the status, the SDK version, and a release tag. The result is a full observability product, scoped to the client libraries you ship.
How the de-minification works
A raw production stack trace from a minified bundle is noise. Octri turns it back into your source.
- The generated SDK reports an error at runtime, tagged with a release.
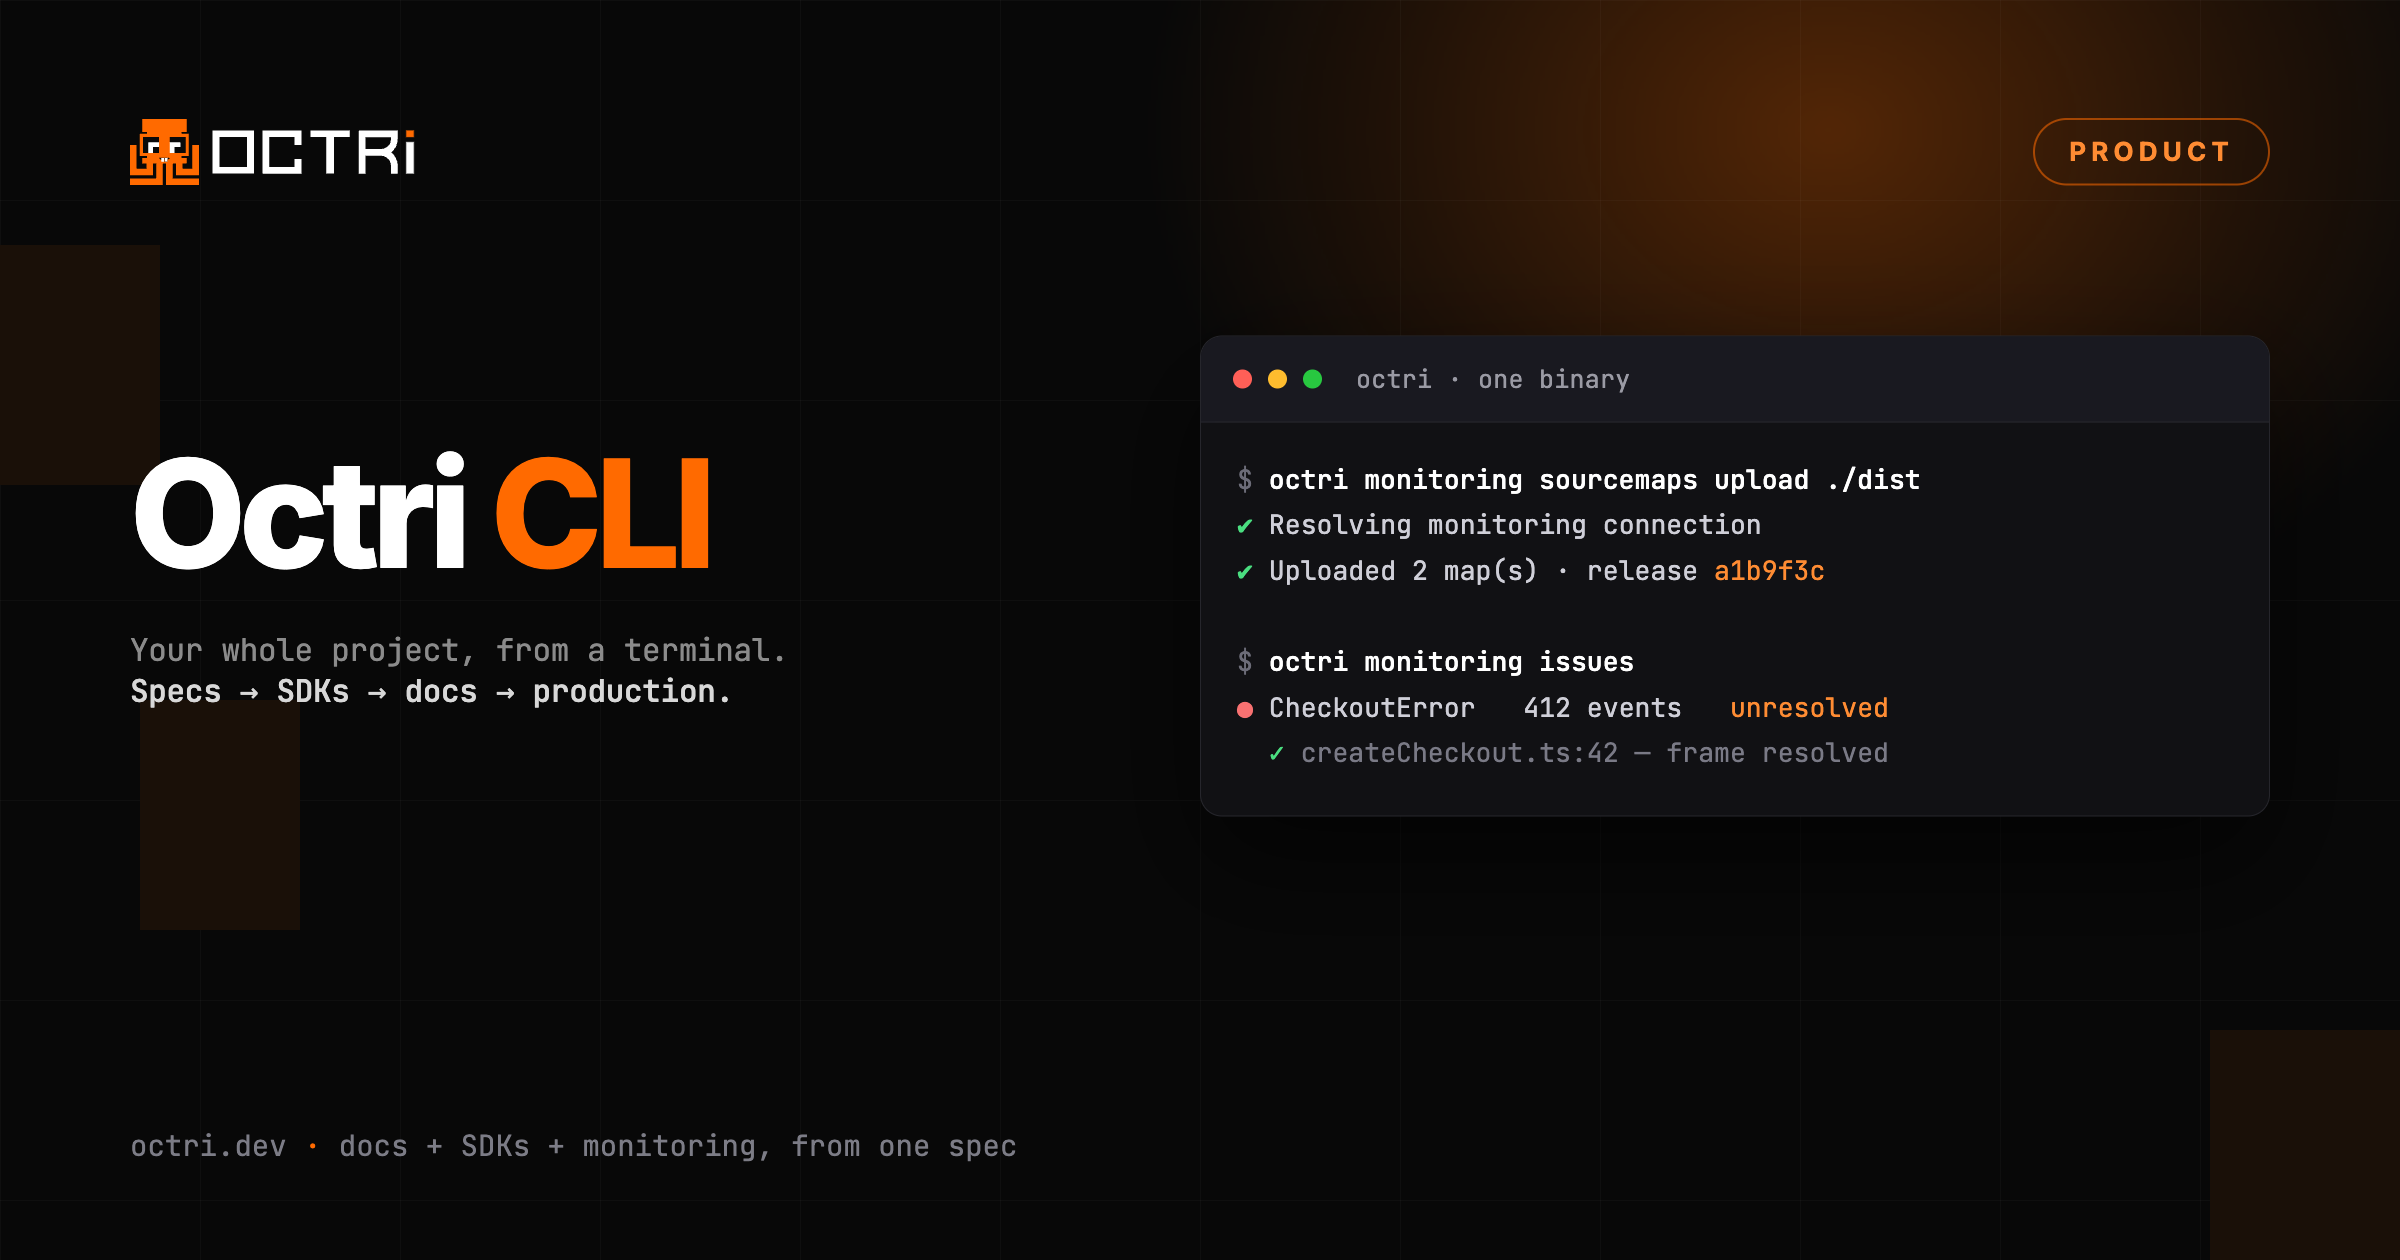
- You upload source maps from CI with the
octriCLI, tagged with the same release, usually the git SHA of the build. - Octri pairs them on read, so an incoming production trace de-minifies to your original source, line and column.
That single invariant, the release the SDK reports must equal the release you uploaded maps for, is what makes a minified blob resolve to a real file and function you can open.
A mismatch here fails silently, which is why it gets its own guide. Readable stack traces covers what to upload for each language and how to check the release before you deploy. The CLI reference has every flag, and CI setup wires the upload into your pipeline.
What you get in the dashboard
Monitoring is a set of views, not a single error list. Each one has a guide:
- Overview. Error rate, total events, distinct issues, latency percentiles, and your top issues at a glance, with a live tail over websocket so new events appear as they happen.
- Issues. Errors grouped into issues, with triage, breadcrumbs leading up to the failure, full event context, and de-minified stack traces. Suspect commits point at the change most likely responsible.
- Traces. Follow a request across services with a waterfall view and a service map.
- Performance. Latency percentiles per endpoint, so slow calls surface before anyone reports them.
- Releases. Track the health of each release and catch a regression the moment it ships.
- Alerts. Get notified when an error rate crosses a line you set, before it becomes a wave of tickets.
- Synthetics. Run uptime checks against your endpoints.
- Logs and source maps. Search logs, and manage the maps that make every trace readable.
Every tab narrows the same way, with a filter builder or a query. The search and filters guide covers the fields and operators they share.
What it changes day to day
You stop learning about SDK failures from support tickets. You open a dashboard and see which endpoints break for real integrators, ranked by how often, each one resolving to a clean stack trace in your own code. You fix the bug, ship a release, and watch its health in Releases. The loop that used to take weeks of back-and-forth with a customer takes an afternoon.
No separate tool to wire up
This is the part that surprises people: there is nothing to bolt on. You do not stand up Sentry, wire a DSN into a generated client, and hope the source maps line up. It is built into the SDKs Octri already generates for you, and monitoring is included on every plan, starting with the free tier. As far as we have found, it is the one thing no other SDK generator offers, because only the tool that owns the SDK can.
Turning it on is a toggle. Setup covers it, along with the two steps after it that people miss: rebuilding your SDKs, since the telemetry connection is compiled in at generation time, and uploading symbols from CI. If you want the argument rather than the instructions, why generated SDKs break silently is the longer version.
Generate a monitored SDK from your spec, free. Get started.