By the Octri team · Updated
Which API metrics should you track? The four golden signals, per operation
A dashboard can contain dozens of perfectly accurate charts and still fail to warn you that the API is about to fall over. The interesting metric may be a database pool approaching its limit, not the CPU graph you normally watch. Or it may be a sudden drop in traffic rather than a rise in errors.
For most APIs, begin with traffic, errors, latency, and saturation. Track them per operation, and use the other measurements to explain what changes in those four actually mean.
Which API metrics should you track?
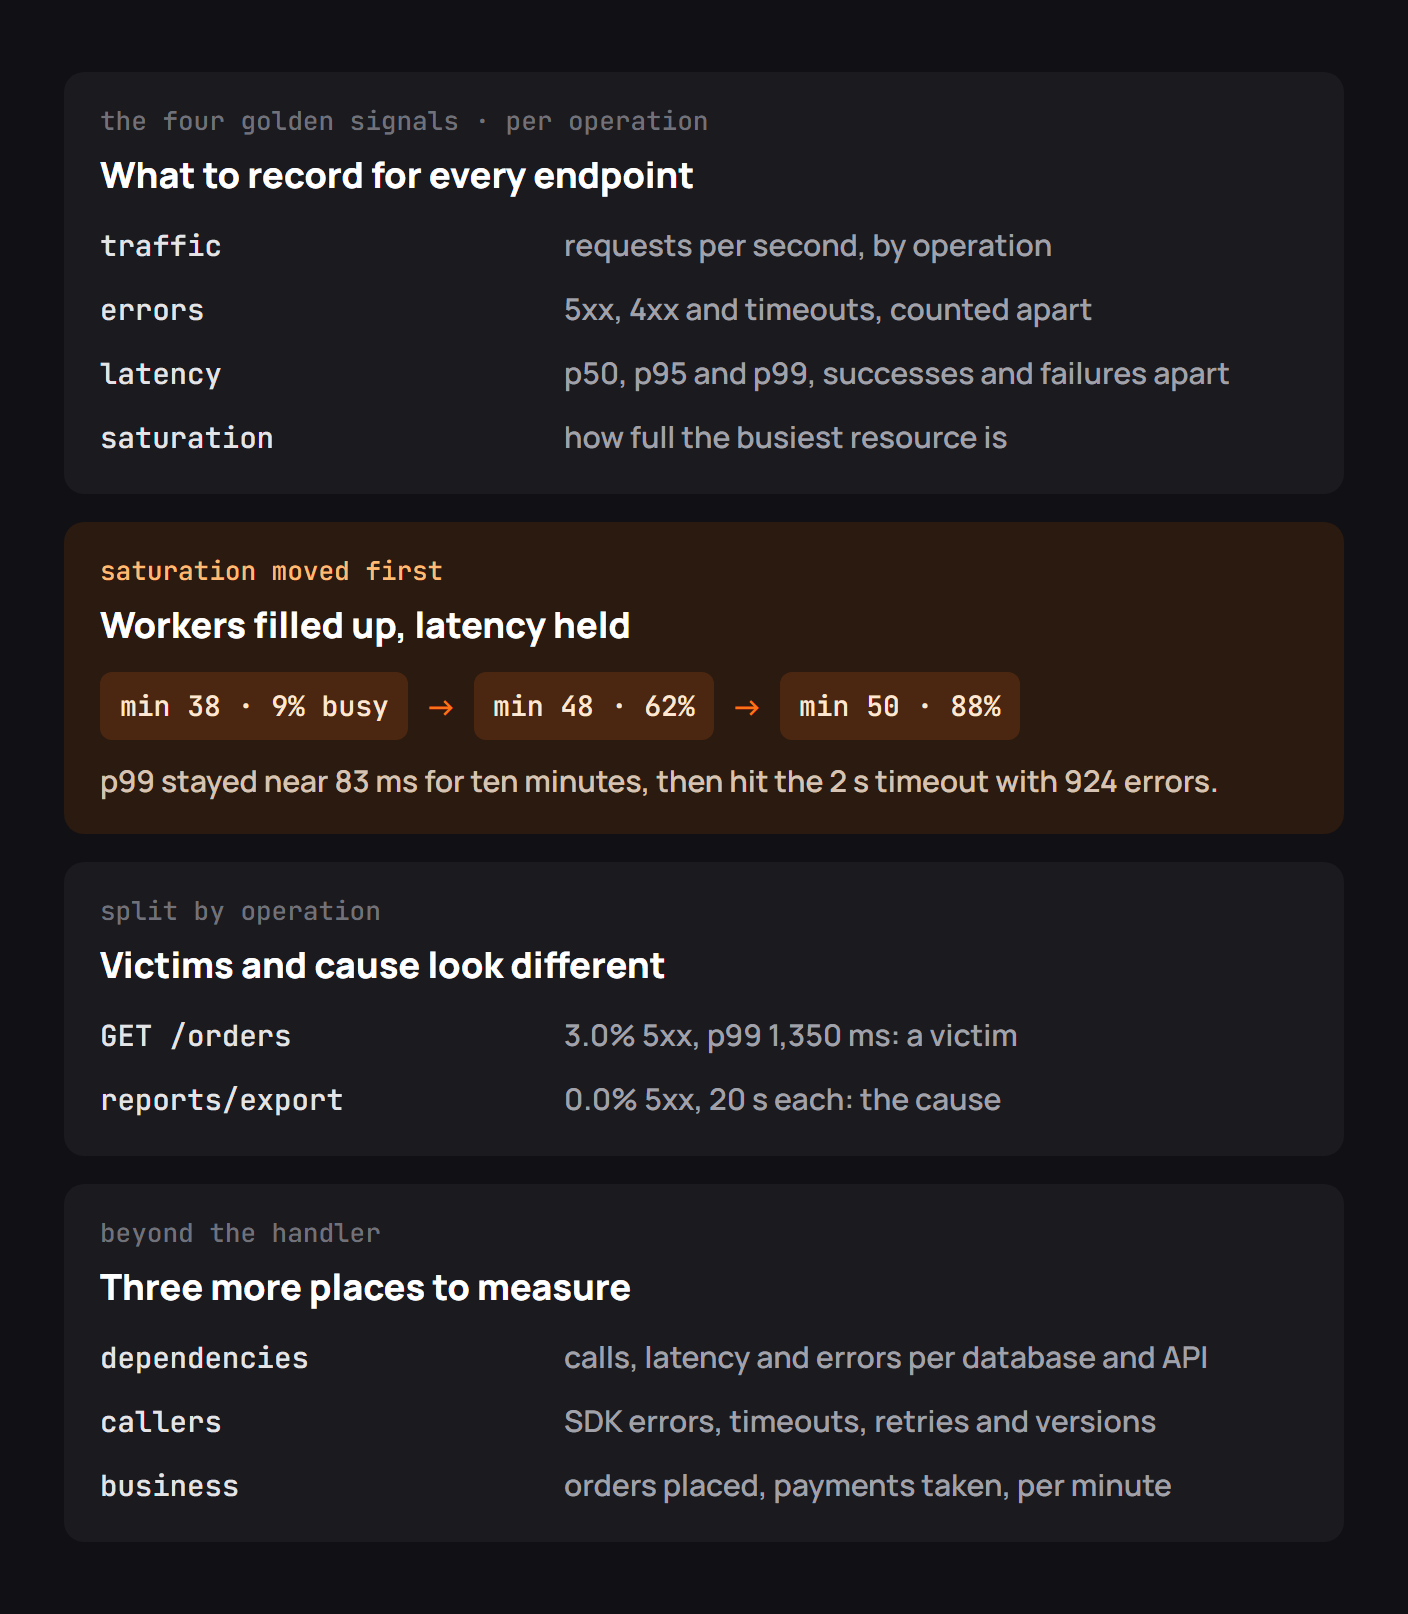
The four golden signals are a compact starting point for request-serving systems:
| Signal | Useful measurement | What it can reveal |
|---|---|---|
| Traffic | Requests/sec by operation and region | Growth, unusual bursts, missing traffic |
| Errors | 5xx rate, client timeouts, 4xx categories | User-visible failure and regressions |
| Latency | p50, p95, p99 for successful requests | Slow operations and long-tail delays |
| Saturation | Worker usage, connection pools, queue depth | Capacity approaching a limit |
Record important dependencies and SDK-side outcomes as well. If the server logs 200 but the SDK times out before receiving it, the caller experienced failure. If one SDK version sends a request the server no longer accepts, a global error-rate metric may conceal a complete failure for that client group.
An hour of an API under load
A concrete illustration appears in GitHub's May 2026 availability report. On May 4, GitHub experienced elevated latency and failures across several services when a routine online database schema migration overlapped with rising production traffic. The combined load saturated database connection capacity and caused contention and cascading timeouts.
According to GitHub's account, monitoring and on-call observation detected the first signs of impact in roughly three minutes. At peak, about 1.3% of requests returned 5xx responses, averaging around 0.46% across the incident. Engineers paused the migration after identifying it as a contributing factor.
Those error percentages describe the user-visible symptom. Connection utilization and migration load were the leading infrastructure signals. GitHub's follow-up work included plans for dynamically throttling migrations, adding circuit breakers based on latency and connection saturation, and improving monitoring of migration-induced pressure before customers were affected.
The companion diagram illustrates a separate synthetic API-under-load experiment: one operation consumes more workers and the queue grows before ordinary requests begin timing out. Its specific numbers are illustrative, not GitHub's production measurements.
Saturation: the warning before the outage
A saturated resource is one with little ability to handle more demand. That could be a worker pool at its concurrency limit, a database with no free connections, or a queue whose wait time keeps growing.
A critical distinction is usage versus headroom. CPU at 70% doesn't necessarily mean the service can absorb 30% more requests. A connection pool may be full while CPU is idle. Observe the constrained resource for each important workload.
Track saturation alongside latency. If the queue grows but p99 remains steady, you may have time to act. If the queue grows and requests start hitting client timeouts, the problem is already affecting customers.
Errors: count them by kind
Separate server failures (5xx), client-side rejections (4xx), and timeouts. A flood of ordinary 404 responses doesn't necessarily represent an outage. A new spike in 422 just after an SDK release deserves attention, because it may indicate the new client and API disagree about a field.
Aggregate by operation before computing the global number. One high-traffic healthy route can hide serious failures on a smaller, revenue-critical endpoint. Also group by release, SDK version, and region when that metadata is available.
When designing an error SLI, decide whether invalid caller input counts against it. The choice should reflect users' actual experience and stay stable across reports.
Metrics beyond the handler
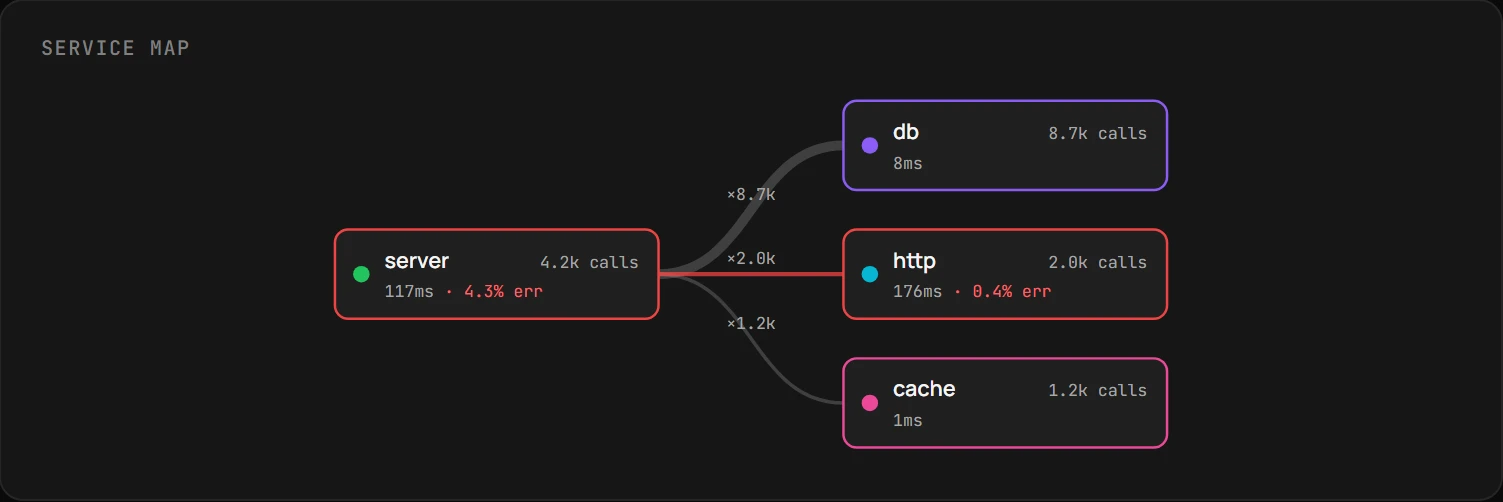
A real request travels through more than one handler. Watch database latency and connection use, cache hit ratio, outbound dependency calls, queue length, and retry counts. Client-side SDKs should report failed requests and the duration they observed.
In distributed systems, the correlation between a rising database connection pool and an API timeout is an investigative lead, not proof of causation. Traces can show which dependency a particular request waited for, and structured events can connect the result to a release.
What to leave out
Do not turn every field into a metric label. Request IDs and customer IDs cause high-cardinality time-series explosions when combined with operations, statuses, and regions. Keep those fields in searchable events and traces instead.
Avoid dashboards dominated by infrastructure details with no explanation of customer outcomes. Heap usage, CPU, and disk queue length can matter, but they are supporting evidence. The primary dashboard should show whether people are successfully calling the API within the expected latency budget.
Also resist paging on every metric. An alert is worthwhile when someone can take a specific action, and an isolated statistical fluctuation should not wake the on-call team.
Checklist for API metrics
- Measure traffic, errors, latency, and saturation for each important operation.
- Report p50, p95, and p99, not just average latency.
- Track client timeouts separately from server-recorded errors.
- Split 4xx, 5xx, and dependency failures into useful categories.
- Record constrained resources such as connection pools and queues.
- Compare performance by release, region, and SDK version.
- Keep request IDs and customer IDs out of metric labels.
- Tie paging to user impact or an approaching reliability budget breach.
API metrics with Octri
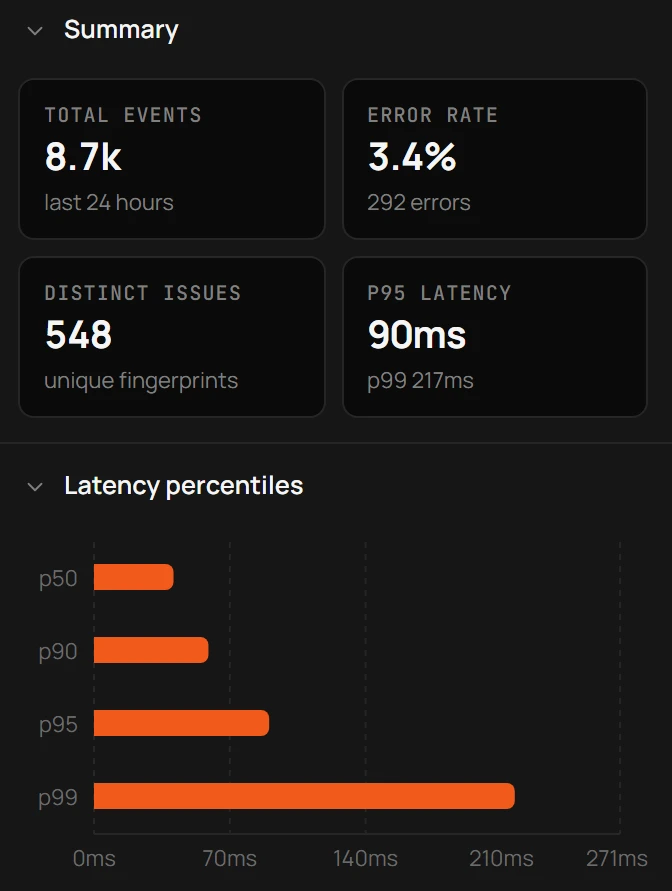
Octri Monitoring provides transaction throughput, error rates, and latency percentiles, with service maps and traces for supported backend instrumentation. Generated SDKs can report failed calls with their operation, status, duration, language, and version, giving visibility into what callers experienced outside the server.
Keep worker, database-pool, and queue utilization in your infrastructure metrics too. Together with Octri's request-level view, those saturation signals help explain why a healthy-looking API can suddenly begin dropping or delaying requests.