By the Octri team · Updated
How to set up API alerts: thresholds, windows and who gets paged
The first alert rule a team writes is often the one they'll regret: page someone whenever a request fails. It feels cautious until the API becomes popular enough that routine bad inputs and isolated timeouts keep waking people up.
An alert is a request for someone's attention. Its threshold, duration, and destination should reflect the decision that person can make, not just the number your dashboard can measure.
How do you set up API alerts?
Begin with the user experience you're protecting: successful calls, usable response times, and a reachable service. Infrastructure metrics help explain problems, but a high CPU percentage alone doesn't say whether customers are hurt.
For each alert, decide four things before entering a threshold: the symptom, the evaluation window, the recipient, and the action. A rule with no expected action belongs on a dashboard or in a lower-urgency notification queue.
| Signal | Better starting rule | Why |
|---|---|---|
| Server errors | Sustained 5xx rate on an important operation | Avoids paging on an isolated failure |
| Latency | p95 or p99 above a user-facing budget | A 200 may still be too late |
| Availability | Two or more failed external checks | Filters transient network noise |
| New issue | First appearance of an unfamiliar error after a release | Finds failures not covered by existing rules |
| Error-budget burn | Fast and slow windows | Catches an outage and a quiet regression differently |
A week of alerts, eight rules
To see how rule design changes the experience of an on-call engineer, I ran a smaller local exercise with 120 minutes of synthetic traffic. Ordinary background noise produced one failed request every minute. At minute 30 a three-minute spike produced 80 failures per minute; at minute 70 a quieter problem began producing 17 per minute for fifteen minutes.
The results depended entirely on how the rule interpreted the same data:
| Rule | What it reported |
|---|---|
| Any error in a minute | 120 minutes eligible to alert, including all the harmless background noise |
| 20 or more errors in one minute | One incident beginning at minute 30 |
| At least 70 errors in a five-minute window | An incident beginning at minute 30 and another at minute 74 |
The five-minute rule noticed the quieter regression after it accumulated enough evidence, without treating every ordinary failure as an emergency. This is a deliberately simplified count-based example, not a complete SLO burn-rate implementation; real traffic volume changes the denominator and should change your thresholds too.
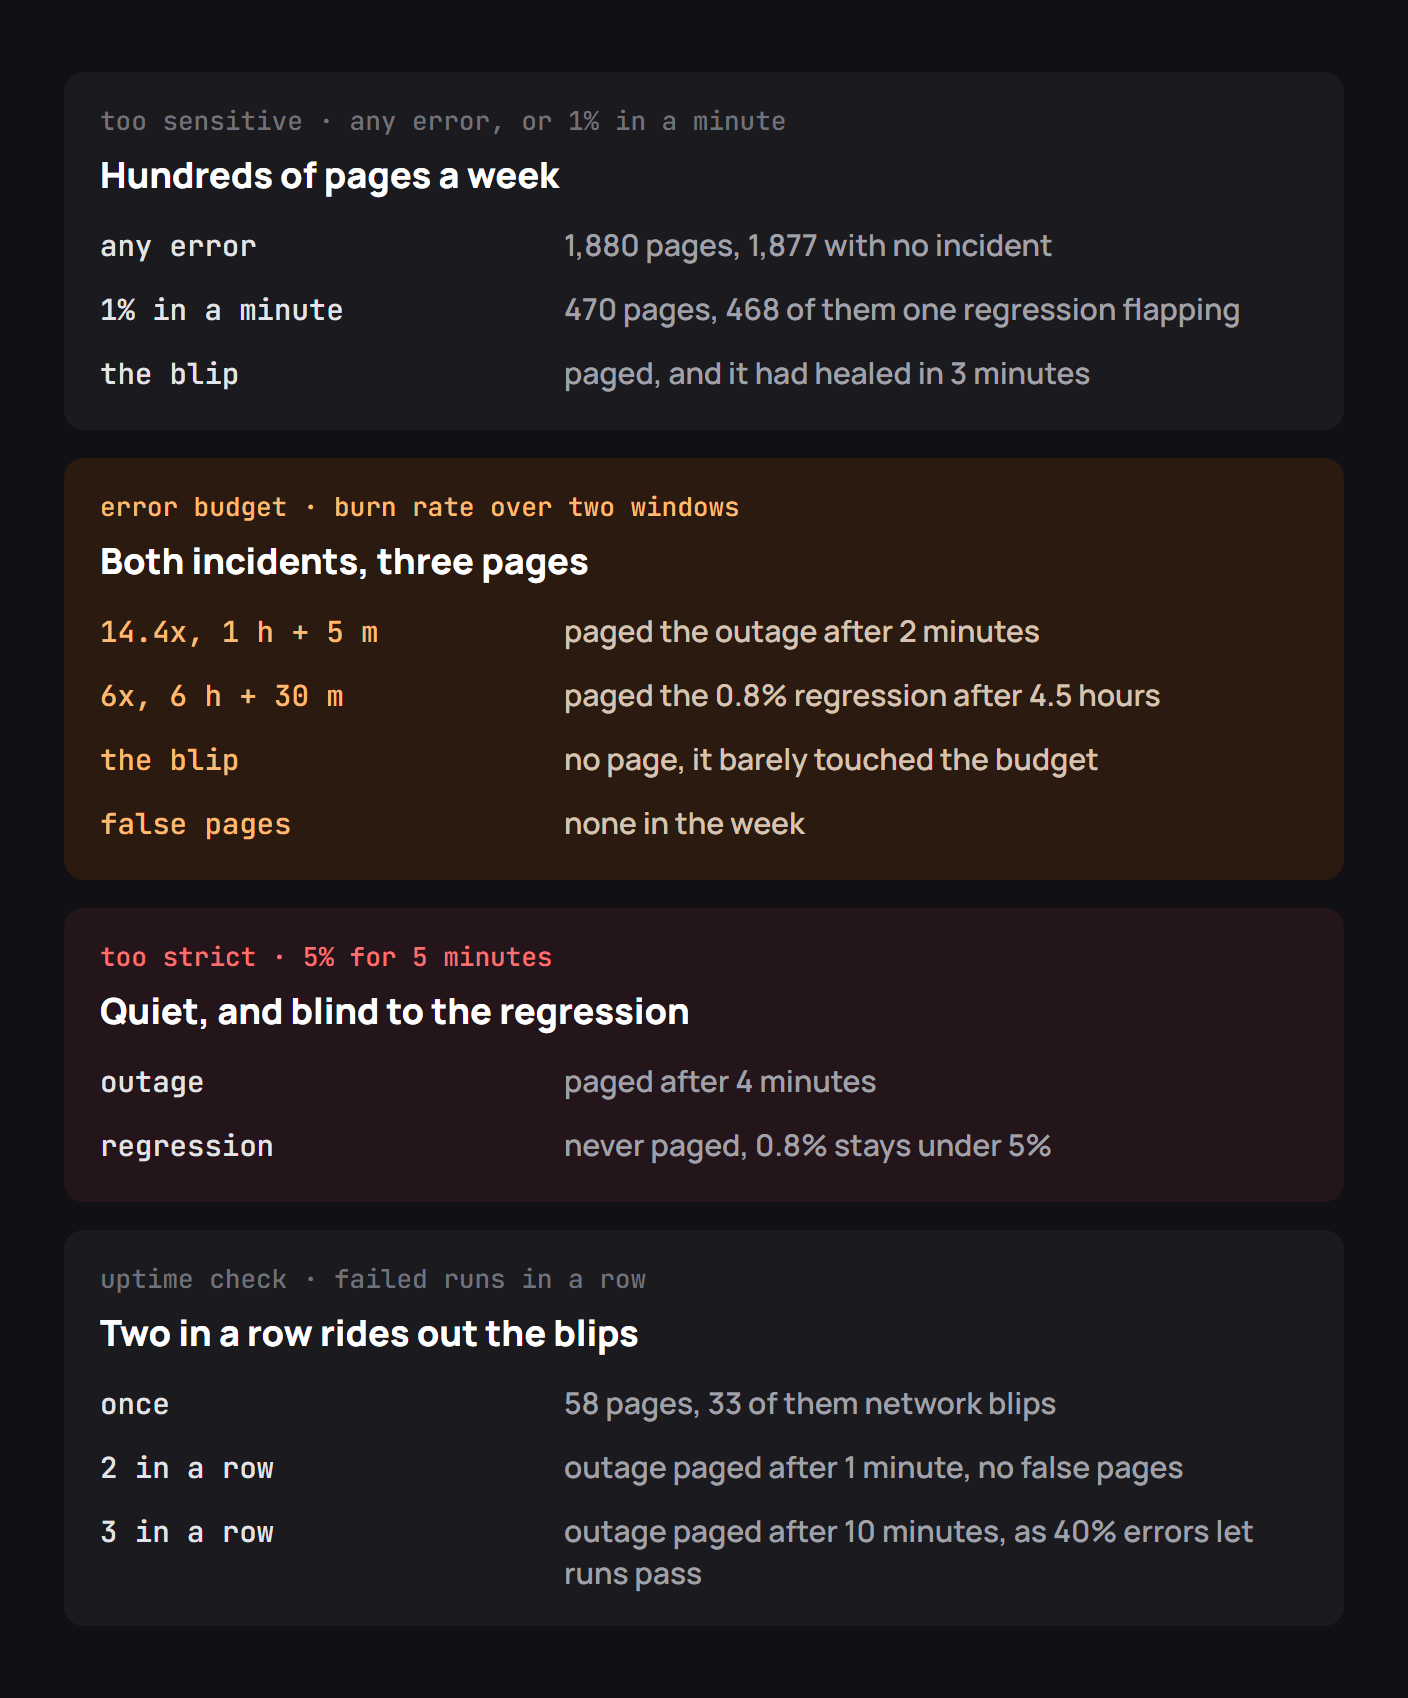
The original week-long simulation illustrated in the diagram makes the same point at a larger scale: rules that react to every event generate far more interruptions than rules designed around sustained user impact. The precise counts in a simulation are less important than which conditions deserve a human response.
Set thresholds from the error budget
Suppose the availability objective is 99.9% good requests over 30 days. That leaves an error budget of 0.1%. A five-minute error rate of 1% is consuming budget at ten times the sustainable rate. A 5% error rate burns it fifty times faster.
Calculate the burn rate as:
burn rate = observed bad-request fraction / allowed bad-request fractionThe Google SRE Workbook recommends combining longer and shorter windows. The long window makes the condition meaningful; the short window confirms it is still happening. Different thresholds can page on a fast outage and create a ticket for a slow leak.
Be careful with counts. Ten 500 responses in five minutes is critical on an API serving twelve calls, but nearly invisible on an API serving a million. Wherever possible, alert on proportions of eligible traffic, with minimum-volume guards to avoid noisy low-traffic windows.
Make every page actionable
A useful notification should answer the questions an engineer will ask on opening it: what is affected, how many calls are failing, when the change began, what release was deployed, and where to investigate.
For example:
POST /orders: 5xx rate 7.4% over 5 minutes (normal 0.2%). First elevated at 14:08 UTC after release 2.5.0. Open the error group and rollback runbook.
Avoid putting tokens, request bodies, or customer secrets in Slack messages. Include a link to the secure view instead. Route an outage to the on-call engineer, a new noncritical error to the owning team, and a long-running SLO deterioration to an issue that someone will review during working hours.
Use deduplication and a recovery notification. A persistent outage should produce one open incident, with updates, rather than hundreds of identical pages. A cooldown is useful, but it cannot replace a rule that understands when an incident starts and ends.
Test the alert end to end
Before trusting a rule, deliberately make it fire in a test environment. Check that the event reaches your system, the evaluation window completes, the right channel receives the message, and the linked runbook is accessible. Confirm the system also posts recovery instead of leaving a permanent red alert behind.
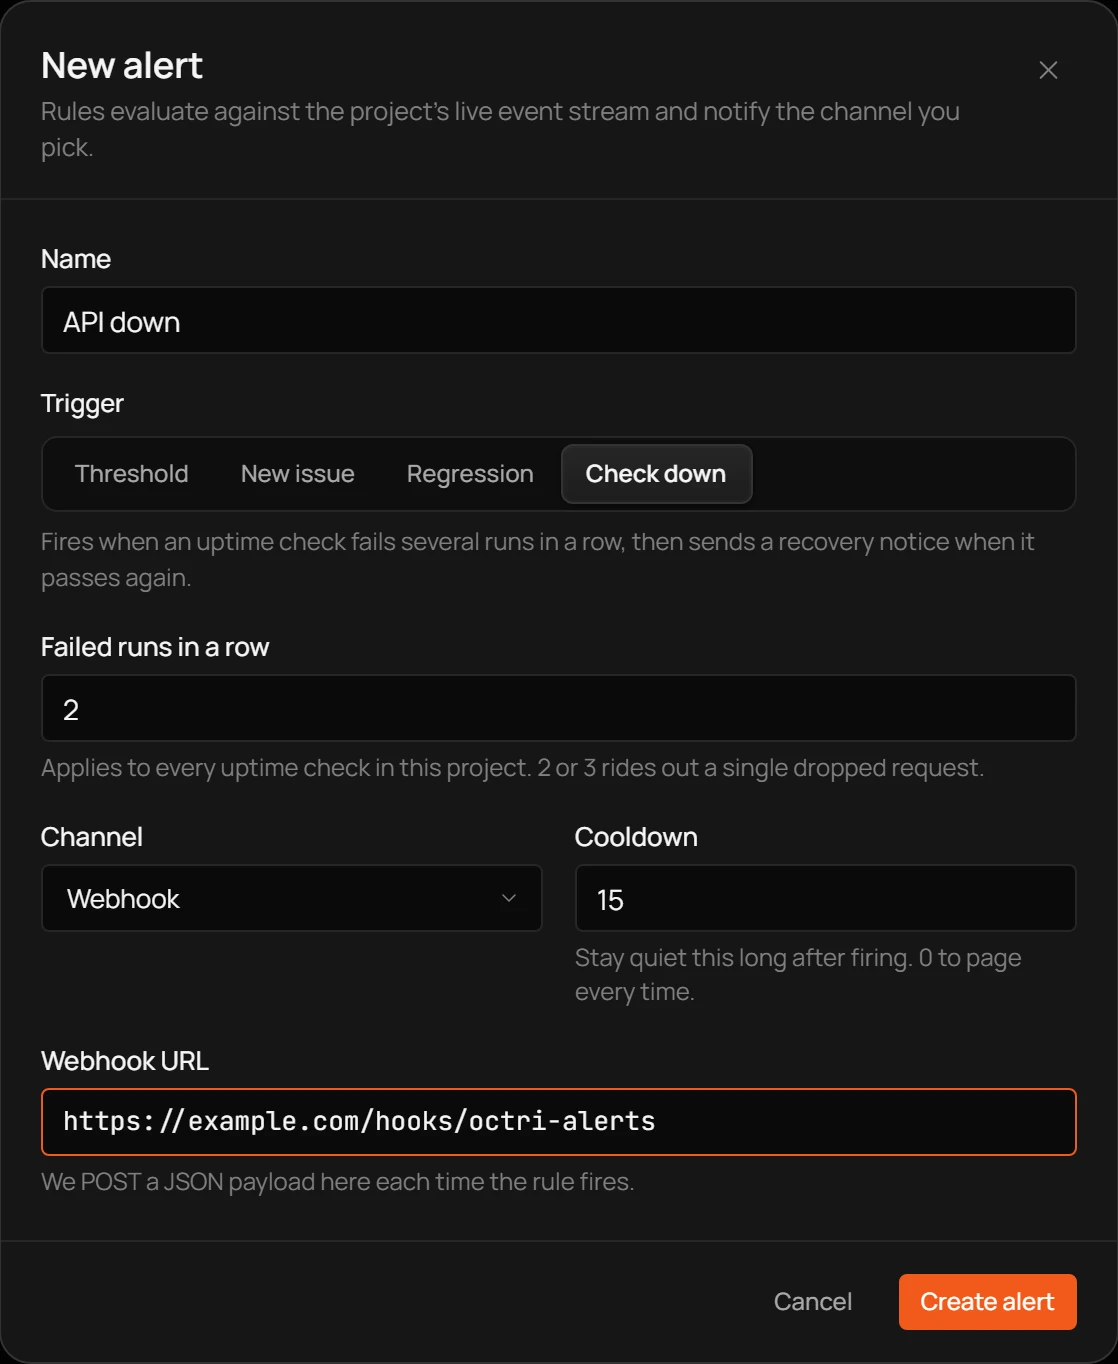
Then test suppression: a single failed check should not trigger a rule requiring two consecutive failures; a recovered check should clear the condition. Acknowledging an alert is not the same thing as resolving the underlying incident, so keep those states separate.
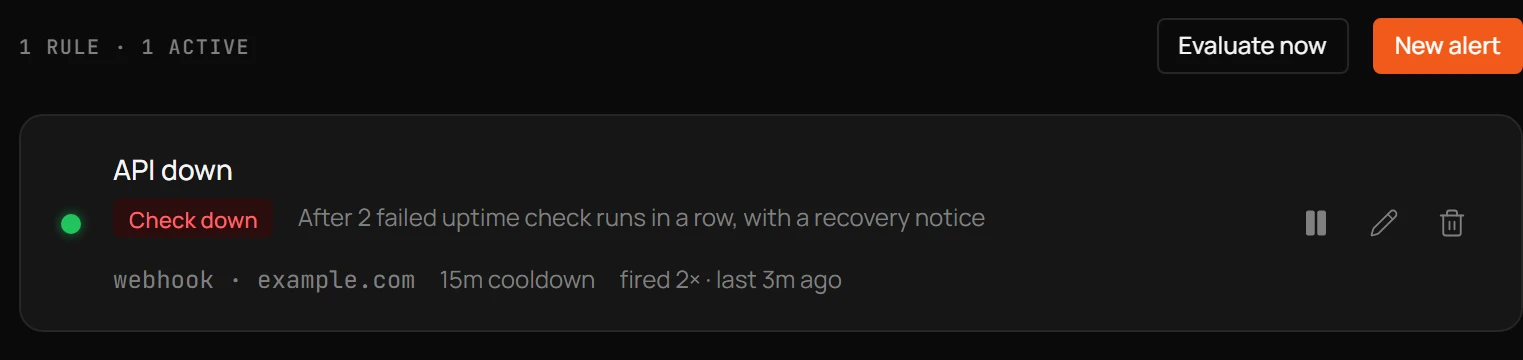
Periodically review alert history with the team. Which pages were ignored? Which incidents escaped detection? Which alerts required no action? That review is where your alerting system actually improves.
Checklist for API alerts
- Define user-visible failure before setting thresholds.
- Separate high-urgency pages from tickets and dashboards.
- Prefer rates and latency distributions over raw counts where traffic varies.
- Pair short and long evaluation windows for error-budget alerts.
- Require sustained failure for uptime checks.
- Include affected operation, severity, start time, and an investigation link.
- Deduplicate repeated events and send a recovery notice.
- Test routing, escalation, silence, and recovery with synthetic failures.
- Review noisy and missed alerts after incidents.
API alerts with Octri
Octri Monitoring supports threshold alerts on events matching a query, new-issue and regression alerts, and checks that fire after repeated uptime failures. Rules can deliver to Slack or a webhook, with a cooldown to reduce repeated notifications. The uptime check's own history helps explain whether the failure was intermittent or sustained.
For an SLO burn-rate policy, calculate and track the rate explicitly in your monitoring setup; Octri's built-in threshold rules are event-count based rather than a native multiwindow burn-rate implementation. That distinction matters when traffic rises or falls substantially.