By the Octri team · Updated
How to find why an API request failed: from a request ID to the root cause
An error report rarely arrives with a diagnosis. It arrives as a screenshot of a 502, an order that never appeared, and a message from someone who has already tried the request twice. The useful evidence is usually present somewhere in your systems. The difficulty is finding the records that belong to this particular attempt.
That is why the request ID is the first thing I look for. A timestamp gives you a neighborhood. An ID gives you an address.
How do you find why an API request failed?
Start with the response the caller actually received. Record its HTTP status, response body, request ID, and time, including the time zone. Then work backward through the systems that handled it.
A good investigation has an order:
- Establish what the caller sent and what they saw. A client timeout can be a failure even when the server eventually logs
200. - Search for the request ID across the gateway, application, and downstream services.
- Follow the trace to find where time was spent and where the first failure occurred.
- Compare the failing request with a successful one on the same operation, preferably from the same release.
- Group similar failures before fixing anything. One report may be part of a larger incident.
An HTTP status narrows the possibilities, but it does not settle them. A 401 points toward authentication, a 422 toward rejected input, and a 500 toward a server failure. A 502 or 504 often tells you the gateway had trouble with a service behind it. The detailed error body and trace explain which case you have.
One failed request, three services
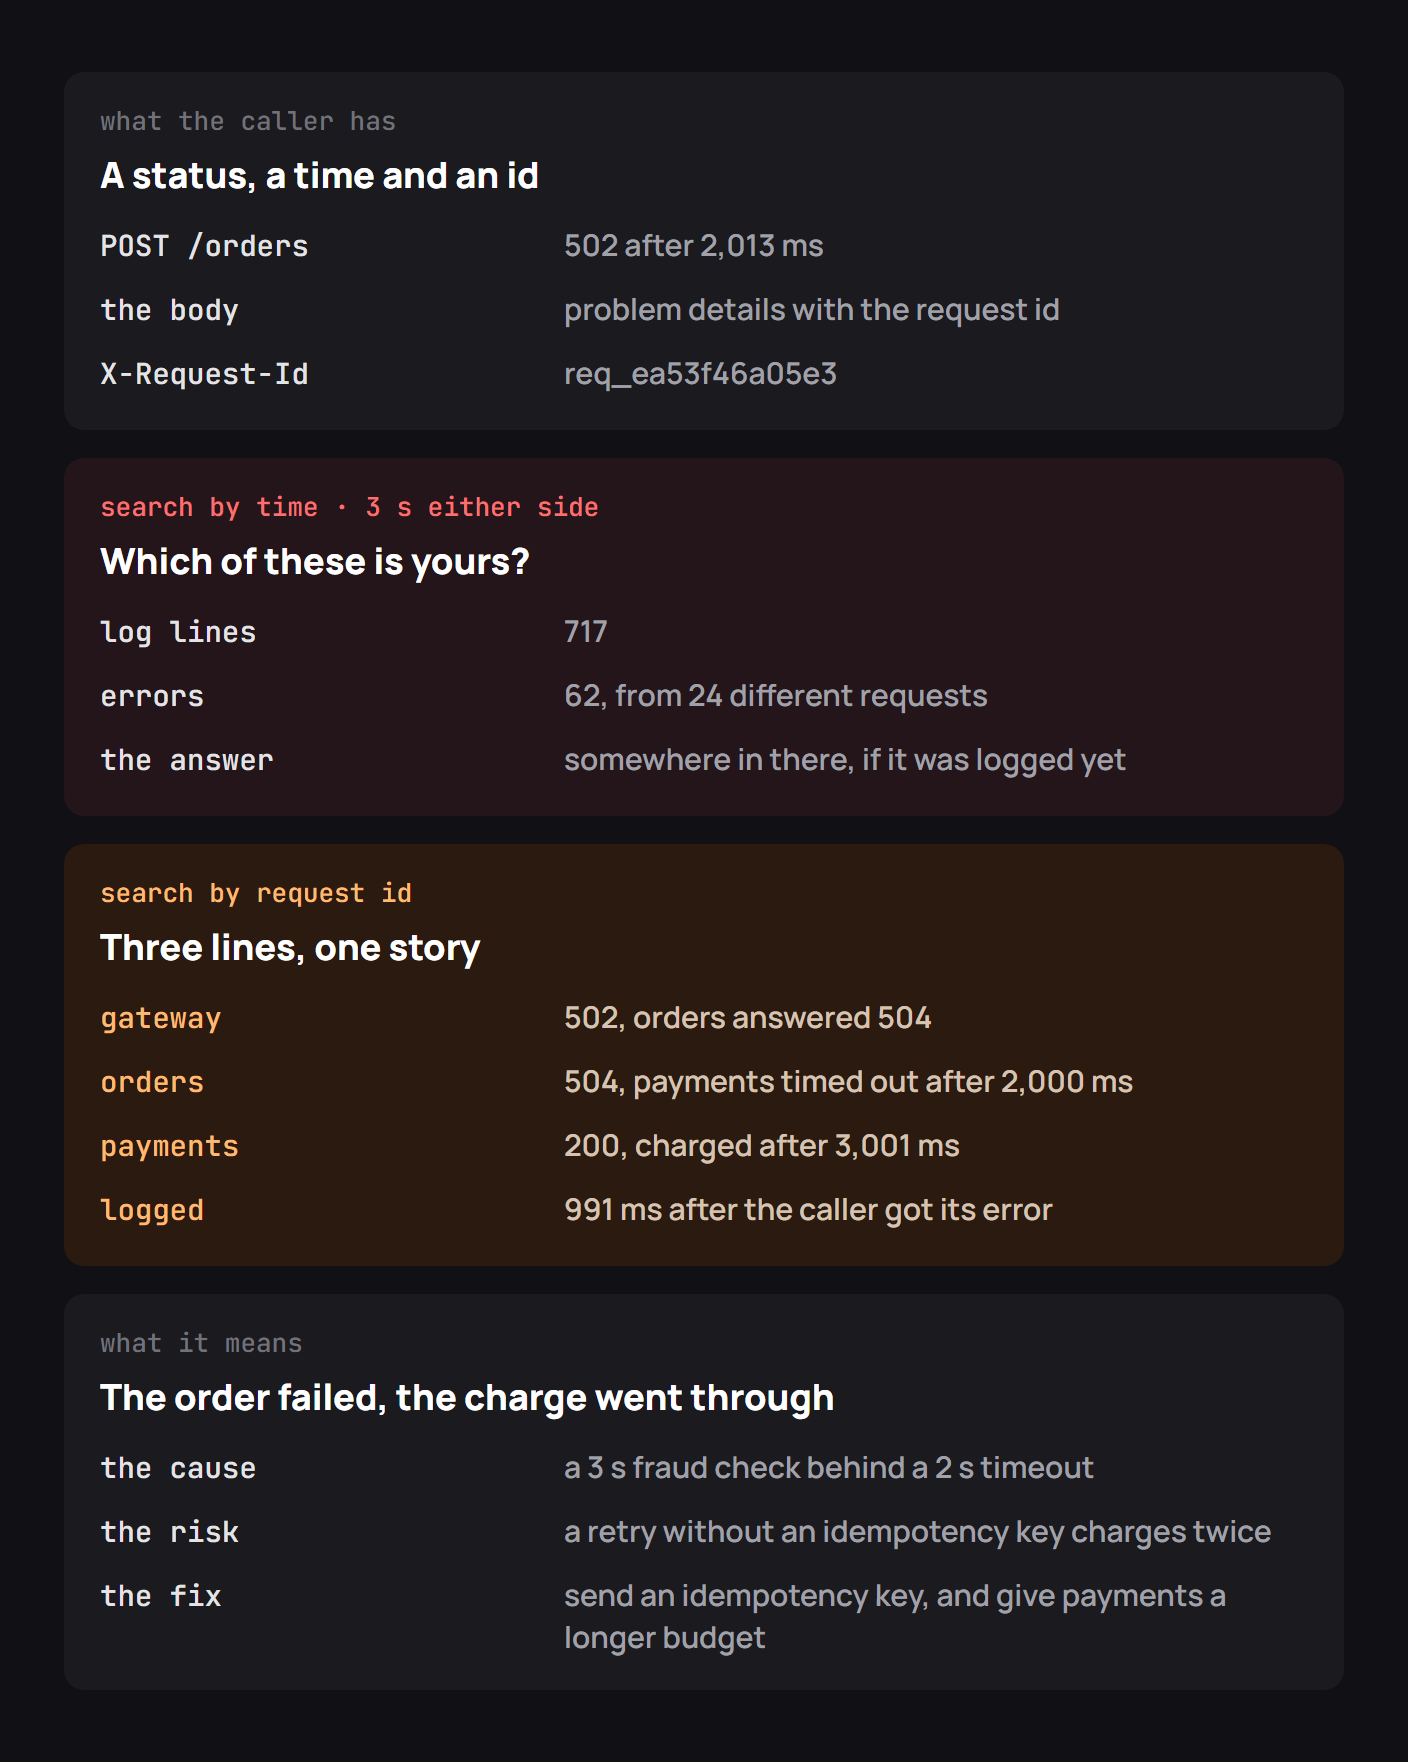
I tried a small version of this investigation with a synthetic log dataset. I created 400 unrelated service records and then added three entries for one failed order: gateway returned 502, orders recorded 504, and payments eventually recorded 200. All three carried req_target.
Scanning the time window meant looking at 403 records. Filtering by request_id == "req_target" returned exactly three, with the services in the order I expected. Nothing complicated happened in the search; that was the point. A field added once at the edge removed hundreds of irrelevant possibilities later.
Here is the essential operation, using JSON log records:
import json

with open("requests.jsonl") as file:
    events = (json.loads(line) for line in file)
    related = [e for e in events if e.get("request_id") == "req_target"]

for event in related:
    print(event["service"], event["status"])
The three statuses tell a plausible story, but they do not prove the payments service caused the timeout. A delayed 200 could have arrived after orders had already given up. The spans and their timestamps are needed to establish the sequence and to determine whether a payment was actually committed. Treating the gateway's status as the root cause would miss the interesting part.
When a customer reports a failure, ask for the entire response if possible, including X-Request-Id. Avoid requesting their secret token or personal information. Those aren't needed to identify a failed request.
Give every response a request ID
Generate an ID at your public edge if the caller did not provide one. Return it in the response and attach it to the log context for every service involved. When a gateway calls another service, forward the ID; don't generate a new, unrelated identifier at each hop.
HTTP/1.1 502 Bad Gateway
Content-Type: application/problem+json
X-Request-Id: req_7b91c

{
  "type": "https://api.example.com/problems/upstream-timeout",
  "title": "A dependency did not respond in time",
  "status": 502,
  "request_id": "req_7b91c"
}
The response above follows the shape of RFC 9457 Problem Details. A request ID is a useful extension field, not a required RFC field. Include a short error code that support staff can search without exposing stack traces to the caller.
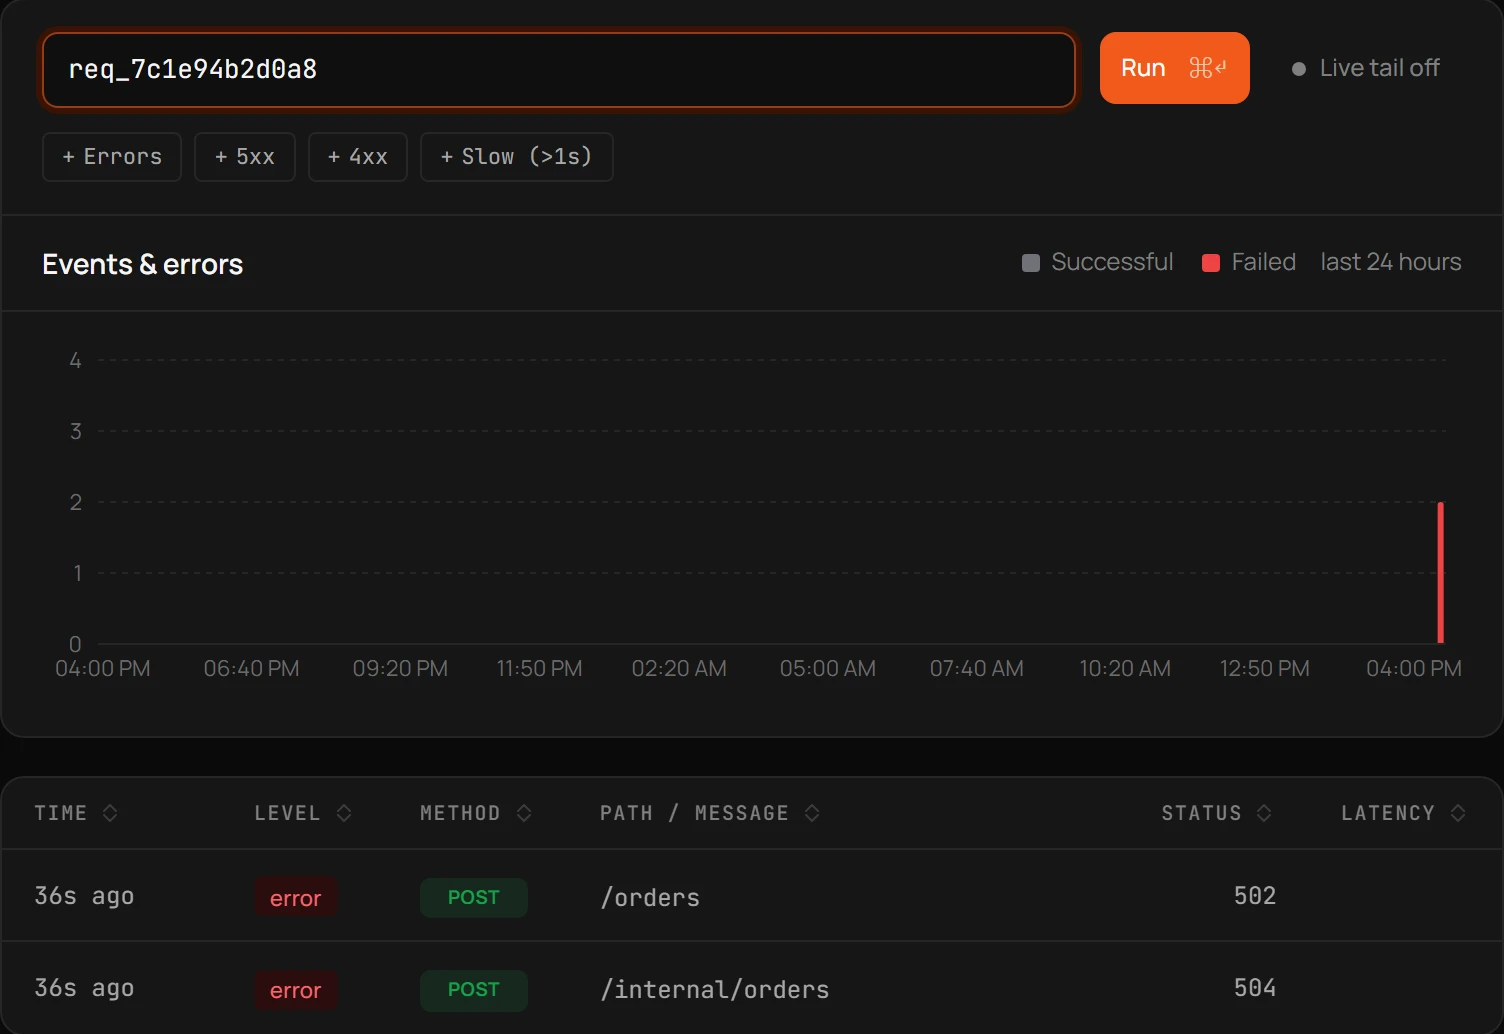
In distributed systems, distinguish a request ID from a trace ID. The request ID is a convenient handle for one incoming attempt. A trace ID connects related spans across services and may cover a larger workflow. Store both; it's cheap compared with reconstructing the link later.
Read the trace
Once you've found the request, open its spans. A useful trace should show at least the gateway, the API handler, the database or outbound request, and the duration of each step. The W3C Trace Context format provides traceparent for passing that identity between services.
Imagine a 502 with a two-second response time. A trace shows orders waiting two seconds on payments while payments finishes at the three-second mark. That changes your investigation from “why did the gateway fail?” to “why was the payments call slower than the orders timeout?” It also raises an operational question: could the payment have succeeded even though the order failed? Before retrying, check the downstream transaction and any idempotency key.
A trace also distinguishes parallel waits from serial ones. Three 300 ms calls in parallel do not add 900 ms to the request, but three serial calls might. A waterfall makes that visible immediately.
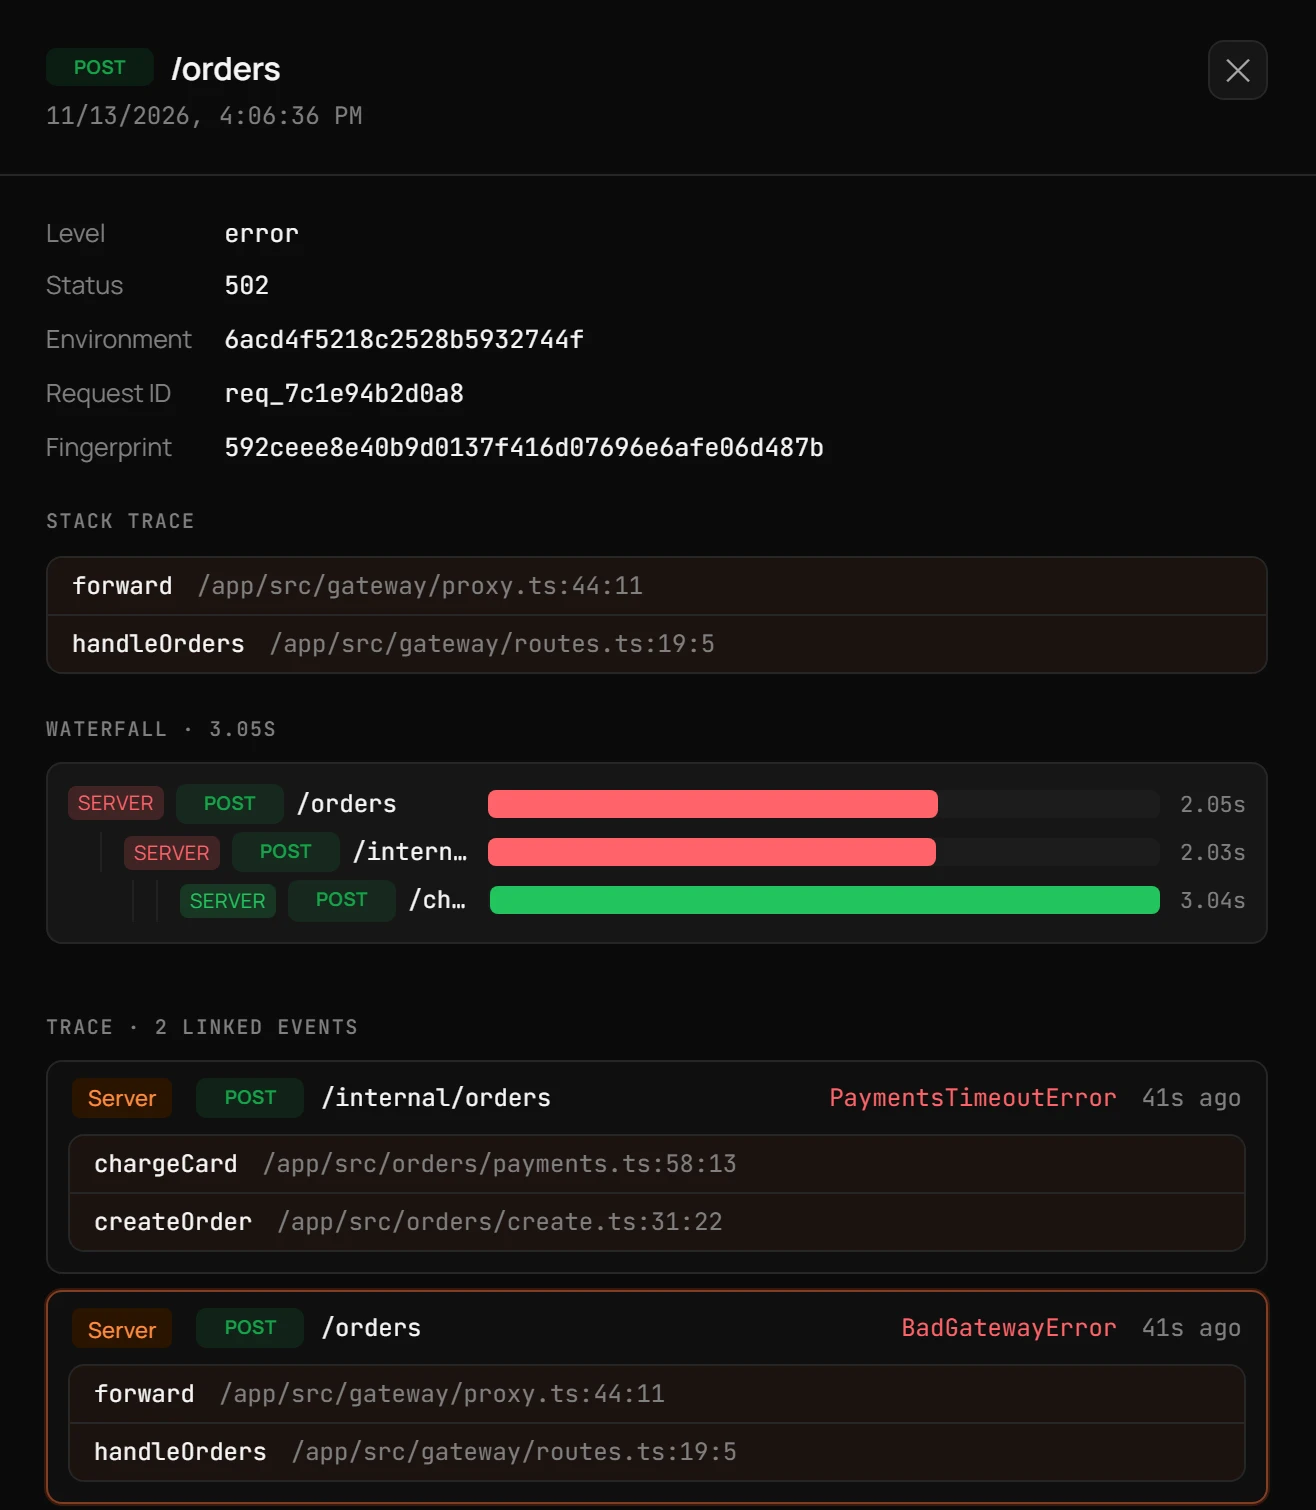
When opening the deepest span, look for the exception, dependency name, operation, release, and timeout configured at that boundary. Do not automatically increase a timeout. A longer wait may simply postpone the failure while holding a worker or connection.
When there is no log line at all
A missing server log is evidence, too. The request may have failed during DNS resolution, TLS negotiation, routing, or a proxy timeout before your handler ran. Client-side SDK telemetry can be especially useful here because the caller may have an exception without any corresponding HTTP response.
If there is no matching request ID, work outward: check edge and load-balancer logs, ingress rules, network errors, then the client. Check for clock skew before comparing timestamps. For retries, use a separate attempt ID as well as a shared logical operation ID, so the second attempt doesn't erase what happened on the first.
A server that logs only completed requests will also miss requests whose clients disconnect halfway through. Record start and completion or cancellation, and make sure the outcome reflects what the caller actually experienced where possible.
Checklist for finding why a request failed
- Return a request ID on successful and failed responses, including errors from the gateway.
- Propagate that ID and
traceparentacross services. - Put an error code, request ID, and safe explanation in the response body.
- Search logs by exact ID before searching broad time ranges.
- Use a trace to locate the first failure, the slowest dependency, and late results.
- Record SDK timeouts and cancellations, even if the server later succeeds.
- Compare the failure by operation, customer segment, SDK version, and release.
- Check whether retries could duplicate a successful downstream action.
Finding failed requests with Octri
Octri Monitoring makes request and trace IDs searchable alongside status, operation, release, and SDK version. An error can lead to its trace waterfall and related events, while issue grouping shows whether other requests failed the same way. With an Octri-generated SDK and a supported backend runtime, traceparent can connect the caller's experience to the server-side work.
That connection is particularly useful for timeouts: the server may have completed its work, but the caller never received the response. You need evidence from both sides before deciding whether to retry, roll back, or fix the dependency.