By the Octri team · Updated
What is observability? Logs, metrics and traces, and the questions they answer
An API dashboard tells you that p95 latency rose last night. You can see the curve. You can often see roughly when it changed. What the chart may not tell you is whether the regression affects one region, one release, or a specific customer workflow.
Observability is what allows you to ask those follow-up questions without shipping new logging code first. It depends on the information your system already records, and on whether those records can be connected into a useful explanation.
What is observability?
Observability is the ability to infer what is happening inside a system from the telemetry it emits. In practice, that means keeping enough detail about requests, errors, dependencies, and releases to investigate failures you didn't predict.
It is often discussed alongside monitoring. Monitoring checks known conditions and raises an alert. Observability helps you discover why the condition appeared, or why a customer is experiencing something no existing threshold recognizes.
The OpenTelemetry observability primer provides a useful foundation for the terminology. But producing telemetry alone isn't enough; it must support questions engineers actually ask.
Logs, metrics and traces
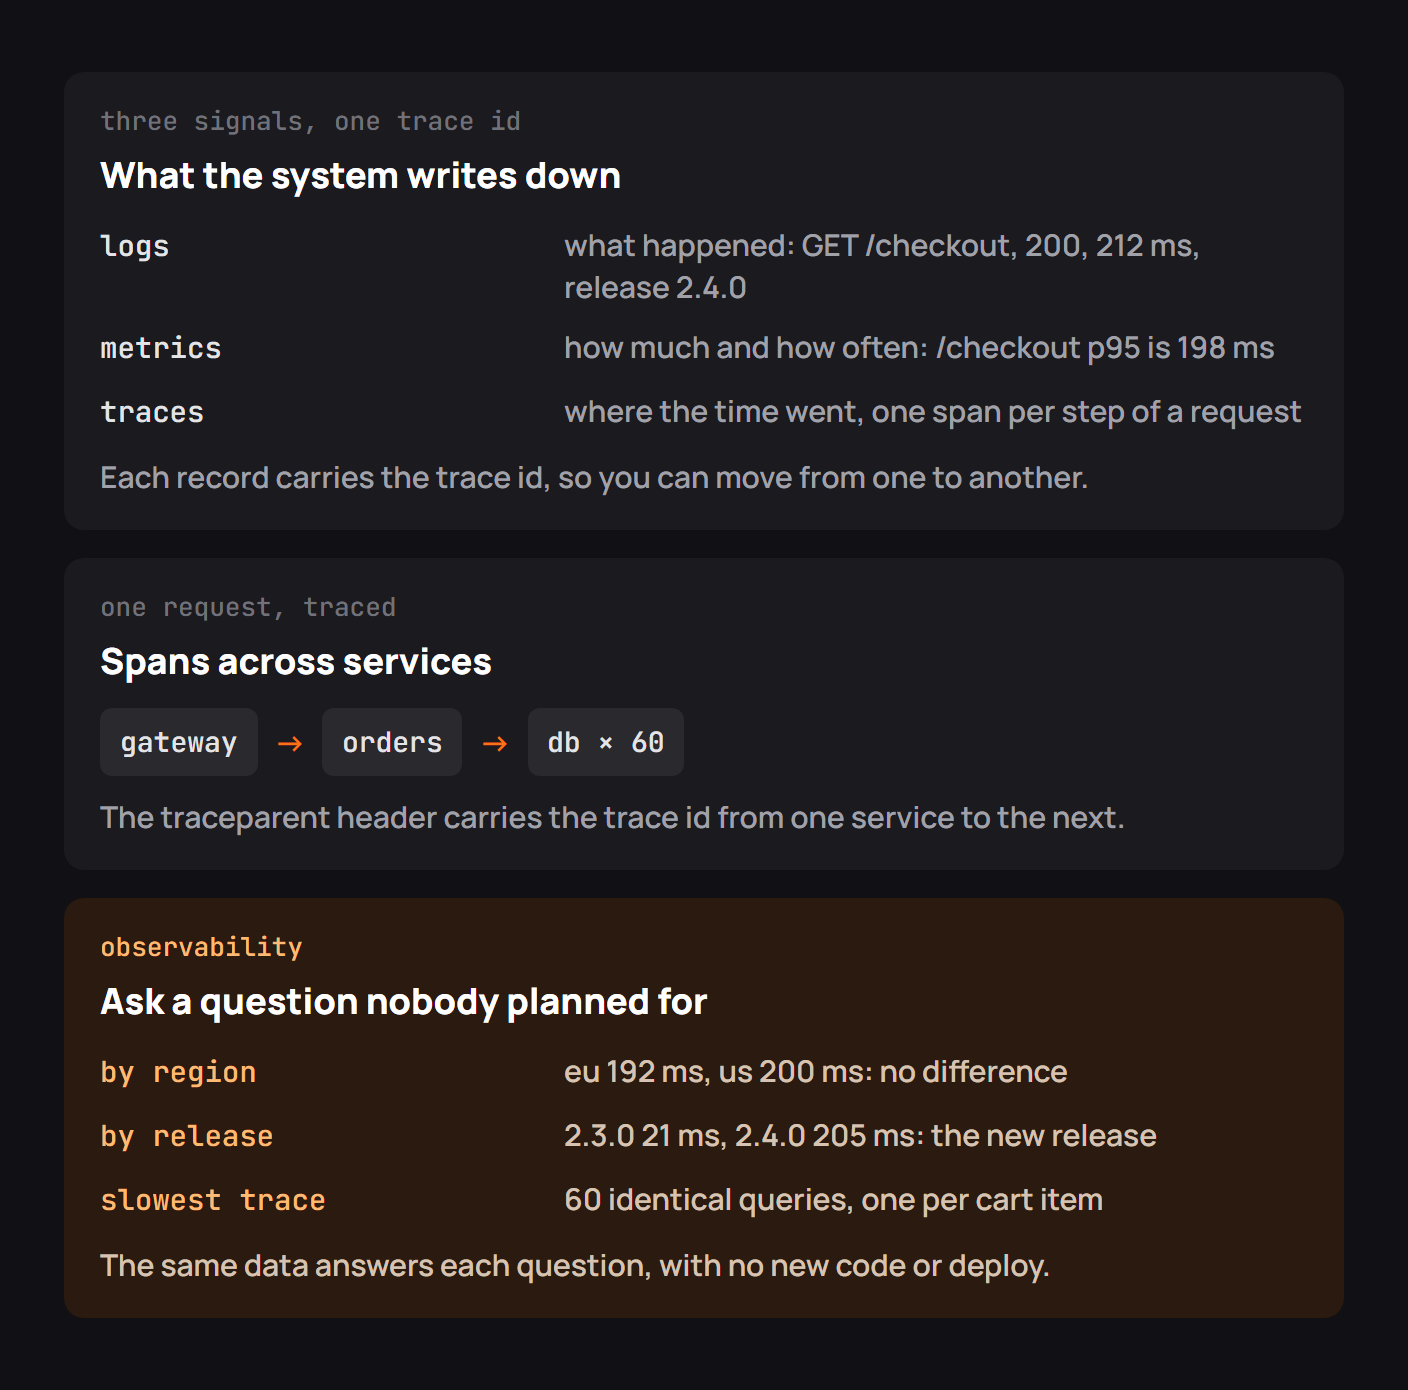
The familiar three signals preserve different information. Metrics are compact aggregates suitable for trends and alerts. Logs are records of particular events, often with error details. Traces show the sequence and duration of work across services for one request.
An API might report an overall 200 ms p95 in metrics, a 502 and request ID in logs, and a payments dependency that spent 1.8 seconds waiting in a trace. The trace ID is what lets an engineer move between those views.
A slow release, found without new code
In a firsthand engineering account titled Our Journey to Observability at Intercom, Intercom describes a problem with its previous, metric-heavy workflow. Engineers could inspect charts sliced by predefined attributes but often needed to move into separate tools to understand what was happening. A key limitation was the absence of high-cardinality context such as customer IDs in those aggregates.
Intercom's team decided to invest more heavily in tracing, using instrumentation it already had in its dependencies as an early starting point. The goal wasn't to replace every chart. It was to let a broader group of engineers ask arbitrary questions about production without becoming specialists in a disconnected set of tools.
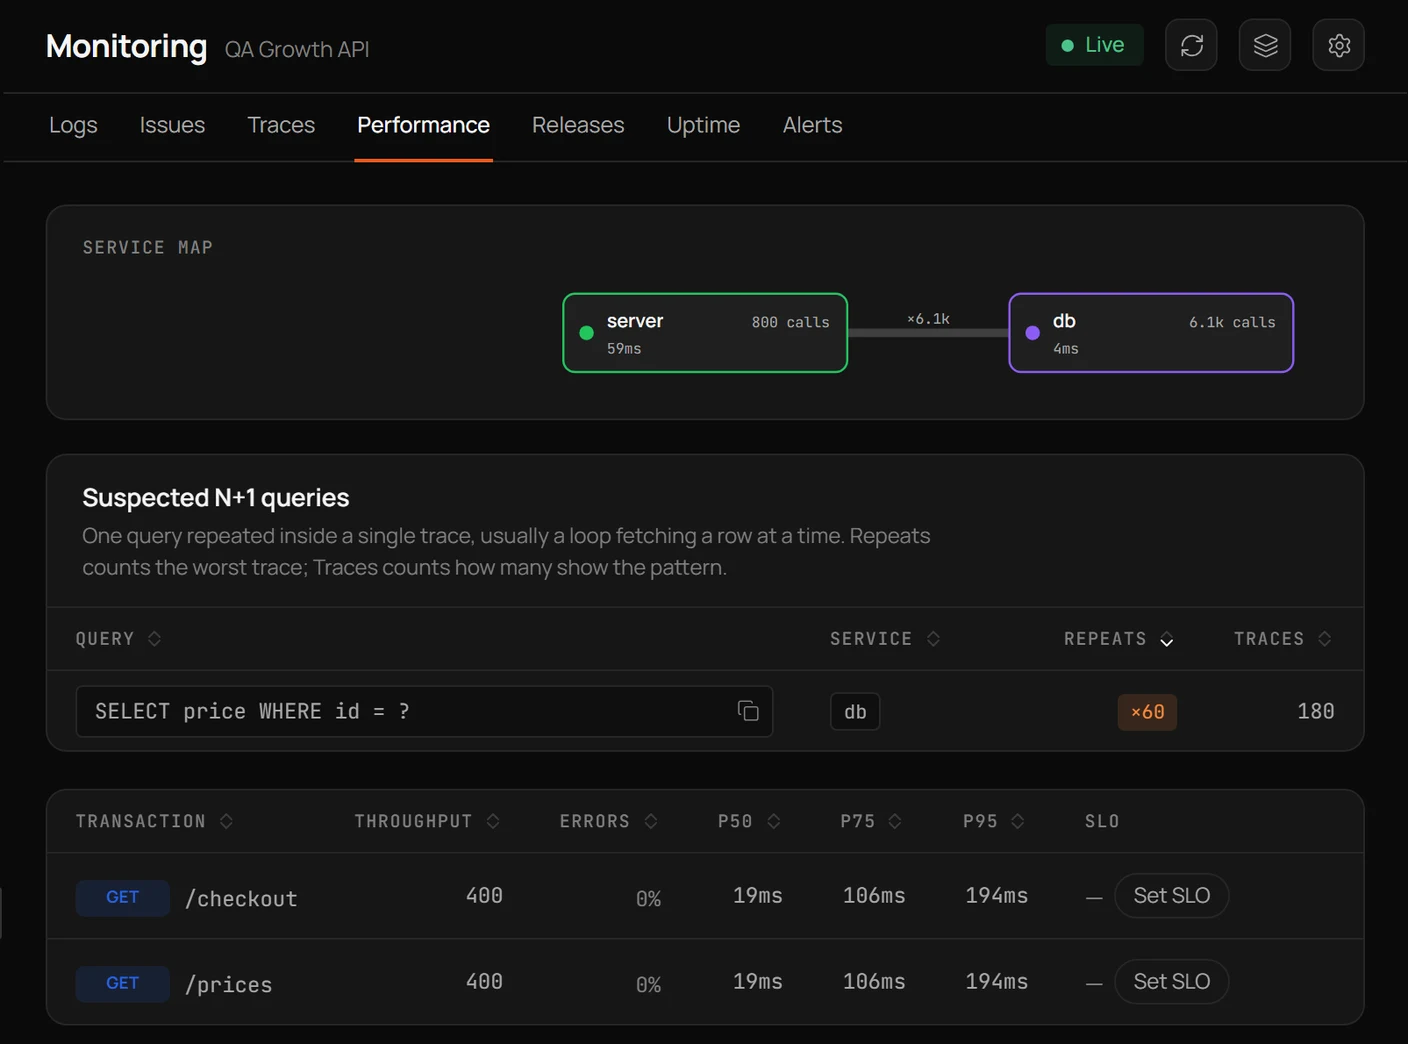
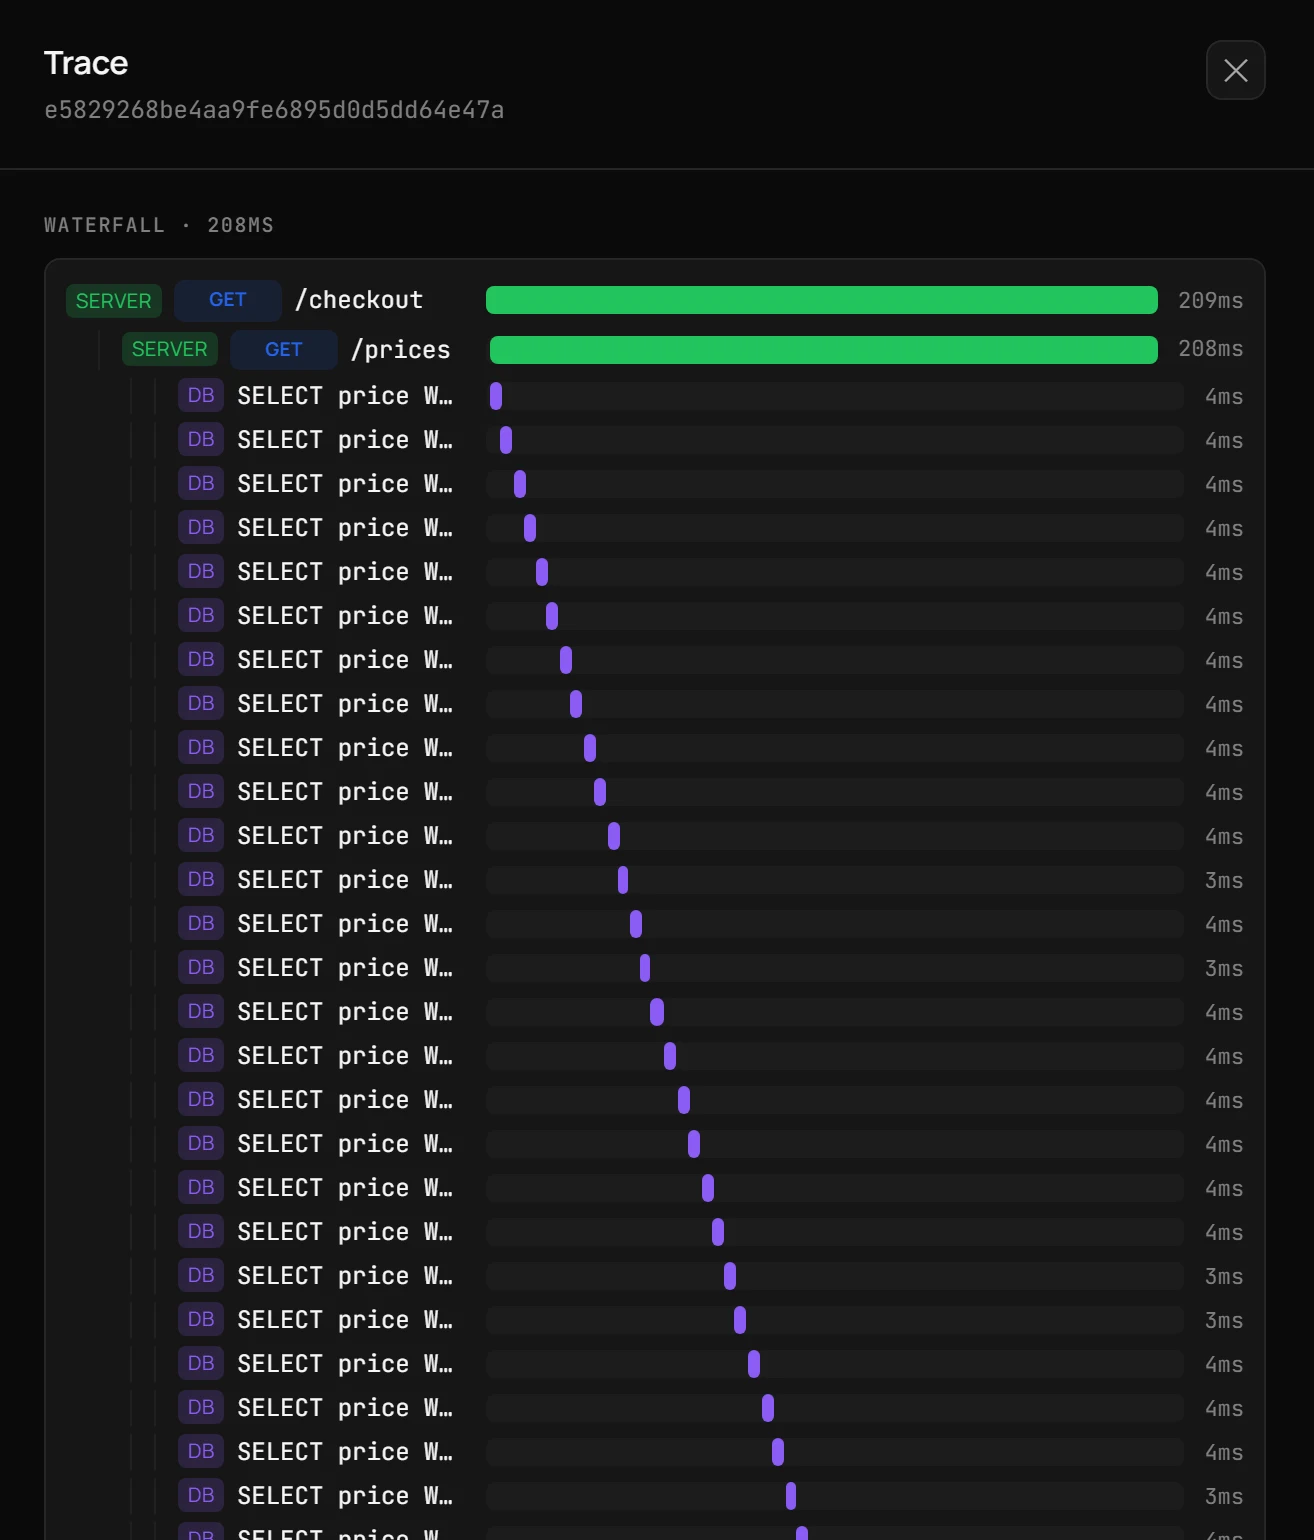
Consider a small, illustrative checkout regression alongside that experience. A new release changes how an orders service fetches prices. The old release uses a single query for a cart; the new one performs one query per item. The overall latency chart rises, but filtering by release identifies the regression, and a trace of a large cart reveals dozens of similar database spans.
Intercom's article does not claim it had this particular checkout bug. The example demonstrates the investigative workflow its engineers were trying to improve: start with an unexplained symptom, add a new grouping dimension, then inspect the request beneath it.
Monitoring and observability
The distinction is clearest during an incident. A monitor can tell you that p95 exceeded 300 ms for five consecutive minutes. It can't know every useful question you will ask after that. Was a new SDK version introduced? Did a feature flag change behavior for a small group? Were only certain database rows affected?
The ability to answer depends on context already in the events. That makes instrumentation a design decision, not a dashboard decoration. A system can produce terabytes of logs and still be difficult to debug if those records don't have shared identities or useful attributes.
Cardinality: why the fields matter
Cardinality means how many distinct values a field can take. Region has relatively low cardinality; customer ID, request ID, and trace ID have much higher cardinality.
Metrics typically keep a separate series for each unique combination of labels, so attaching request IDs to a counter can multiply the number of series dramatically. But an individual event or trace can safely retain a request ID as context, subject to storage and privacy decisions. That difference is why an observability platform needs more than a set of pre-aggregated charts.
When deciding what to record, ask whether an engineer might need to filter by it after a failure. Release, route, SDK version, region, feature flag, and dependency are often valuable. Sensitive identifiers require redaction, access control, and deliberate retention.
OpenTelemetry
OpenTelemetry provides standard APIs, SDKs, and conventions for producing and exporting telemetry. Its context propagation helps spans created in separate services join the same trace through headers such as W3C traceparent.
Start with important request paths and the dependencies they call. Record consistent service names, route names, release information, errors, and durations. Then test whether one sample failure can be traced across a gateway, handler, and downstream call. Broad instrumentation without a readable investigation workflow can create cost without much diagnostic value.
What makes a system observable
Try asking a question you didn't plan a dashboard for: “Which customers are seeing timeouts only on the new release?” If you must add a log statement and redeploy before answering, the system has a visibility gap.
Useful observability makes it possible to move from aggregate symptoms to specific events, and from events to the work done by the system. A query about a particular SDK version should lead to representative request traces. A slow trace should reveal whether time was spent waiting, computing, or repeating a call.
No tool removes the need for engineering judgment. It should shorten the path from an unfamiliar symptom to a hypothesis you can test.
Checklist for observability
- Keep metrics for broad trends and SLOs.
- Retain structured events with useful diagnostic fields.
- Propagate trace IDs across service boundaries.
- Instrument databases and outbound API calls on important paths.
- Preserve high-cardinality context in events and traces, not metric labels.
- Attach release, operation, and relevant client metadata consistently.
- Redact sensitive data and plan retention and sampling.
- Test whether engineers can answer a new production question without redeploying.
Observability with Octri
Octri Monitoring supports searchable logs and issues, transaction performance, and traces for an API and its generated SDK clients. With backend instrumentation, a request waterfall can include database and outbound calls, while SDK telemetry and traceparent help tie the caller's experience to server work.
When one release slows a subset of transactions, the useful path is from a percentile to the affected release, then to a trace showing repeated queries or a slow dependency. That is the kind of investigation observability should make routine.