By the Octri team · Updated
What is API monitoring? What to measure and how to set it up
A green uptime check is reassuring until someone reports that their API requests have been timing out for twenty minutes. Both things can be true. Your check may be calling a lightweight route from one location while actual users are hitting a slower dependency from somewhere else.
API monitoring is the collection of signals that lets you compare those experiences and notice when service quality changes. The central question is whether requests are succeeding for the people who rely on your API, not merely whether a process can answer.
What is API monitoring?
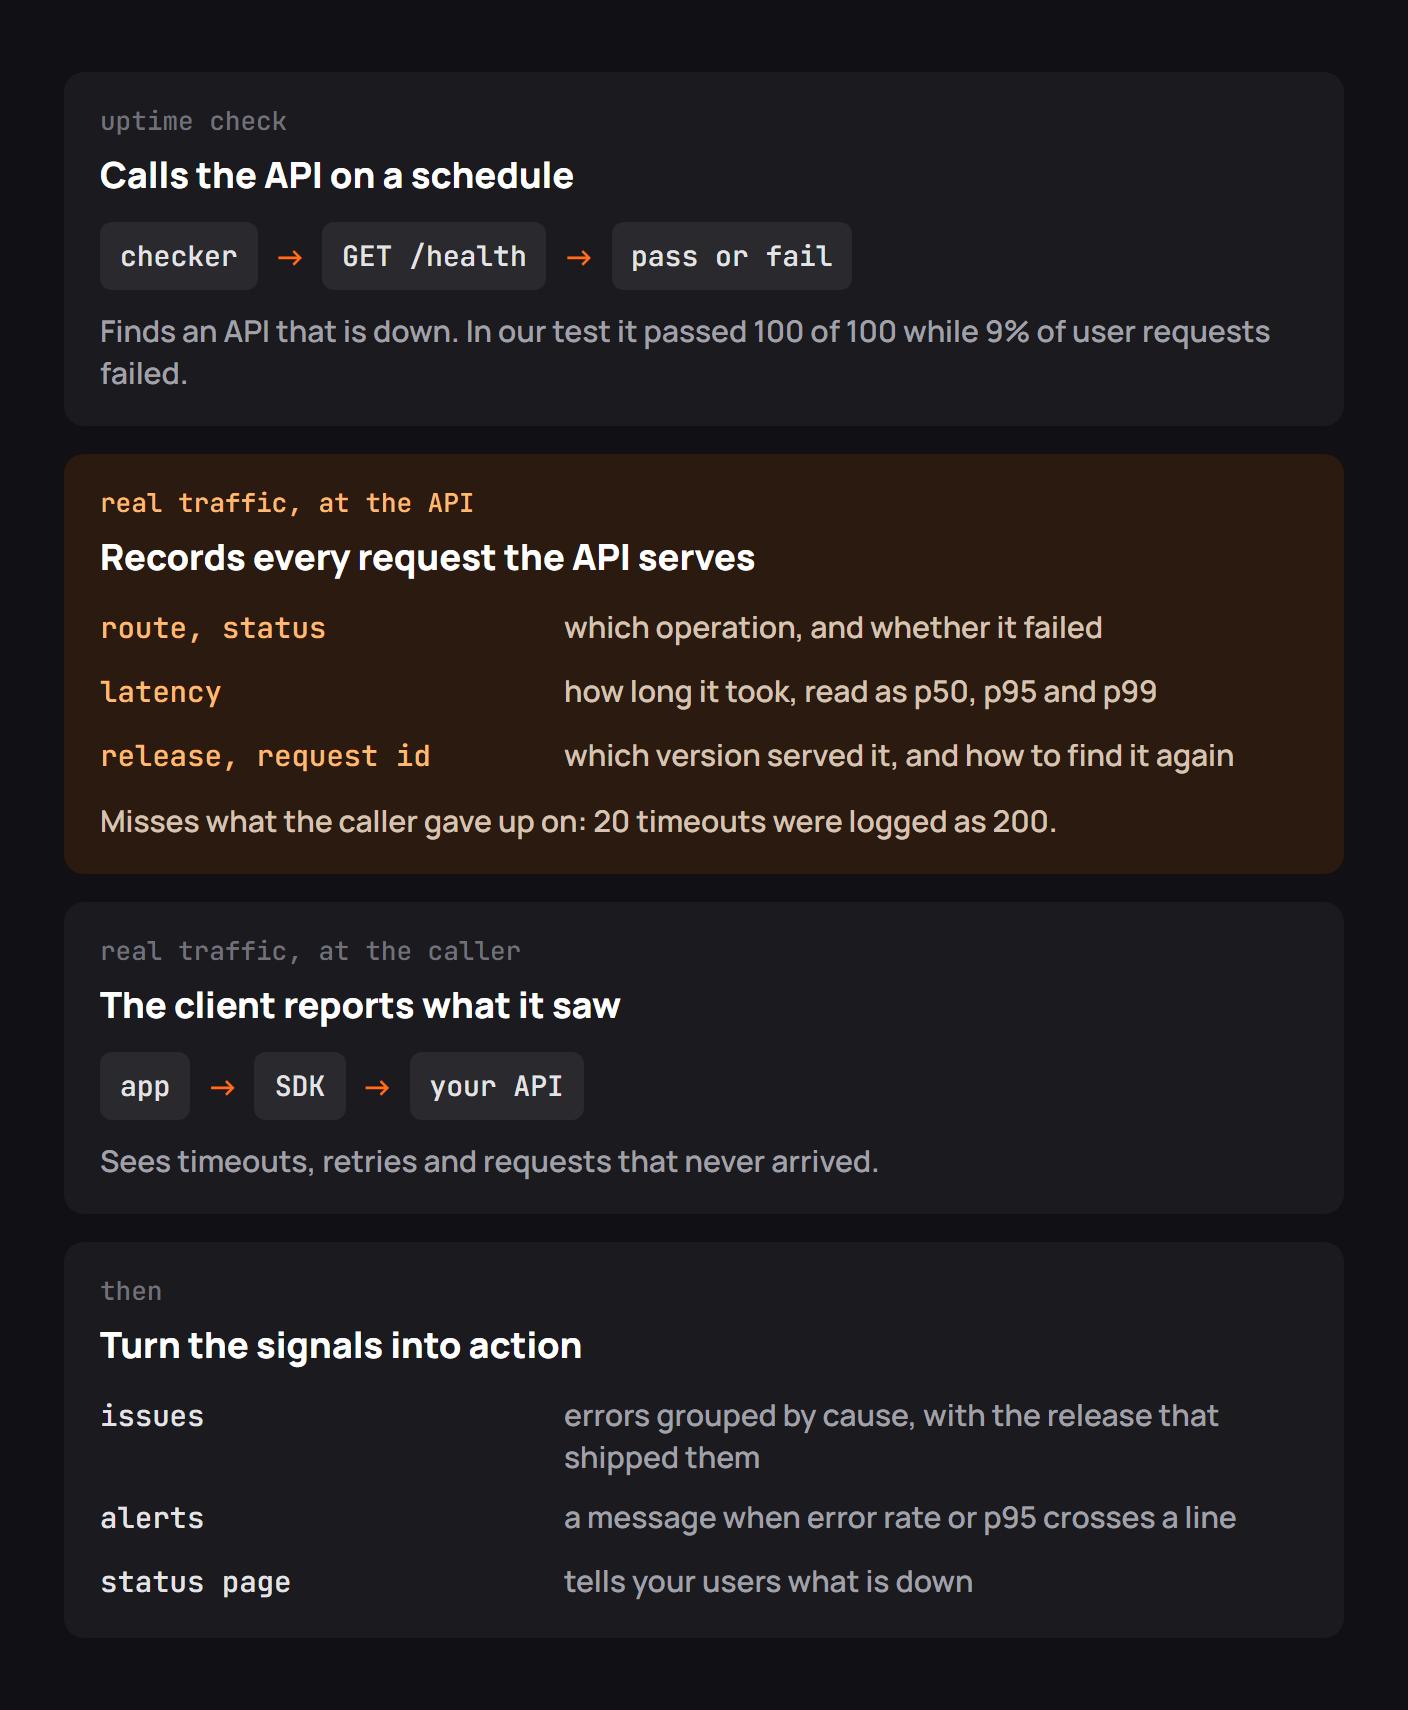
API monitoring combines three useful perspectives. Synthetic checks call known routes on a schedule, revealing reachability and some kinds of failure. Server-side telemetry records the requests the API handled, including status, operation, duration, and release. Client-side telemetry reports what applications and SDKs experienced, including timeouts or network failures that never reached the handler.
Each is incomplete on its own. Synthetic checks cover only the scenarios you wrote. Server logs may say a call completed after the client gave up. The client knows it timed out but not which backend service was slow. Together they provide a more faithful picture.
What to measure
For a useful first dashboard, track the four golden signals: traffic, errors, latency, and saturation. Add uptime checks, key dependencies, and enough metadata to separate important customer populations.
| Signal | API question | Useful breakdown |
|---|---|---|
| Traffic | Are calls increasing, disappearing, or shifting? | Operation and region |
| Errors | Which requests fail, and how? | Status class, error code, release |
| Latency | How long are callers waiting? | p50, p95, p99 by operation |
| Saturation | Which resource is nearly exhausted? | Workers, queue, connection pool |
| Caller experience | Are clients timing out or retrying? | SDK language and version |
Treat 4xx and 5xx separately in dashboards, but don't ignore every 4xx. A sudden rise in 401 or 422 after a deployment can indicate a compatibility problem rather than a wave of careless customers.
A health check passed while users saw failures
Cloudflare documented a useful reminder in its August 21, 2025 incident report. A surge of traffic involving a customer in AWS us-east-1 saturated interconnection links between Cloudflare and AWS, causing high latency, packet loss, and failures for affected origins. Impact began at 16:27 UTC and was substantially reduced by 19:38, with intermittent latency increases lasting until 20:18. Cloudflare explicitly noted that the impact was regional, not a global outage of its services.
The engineering response required understanding which network paths were congested, how traffic was being routed, and which links lacked capacity. A single global “the service is up” number would have been a poor description of the users on those paths.
Cloudflare did not say in that report that its own health checks passed throughout the incident. The distinction here is one we can apply to any API: a probe running outside the affected region, or one that never exercises the saturated dependency, may remain green while real users suffer. Monitor from relevant locations and measure production requests as well as synthetic checks.
This matters to APIs even when everything lives in one cloud region. A public /health route may return 200 while authenticated writes are failing because of a database bottleneck. A client with a one-second timeout can experience failure while the server eventually records success.
Why an average hides slow requests
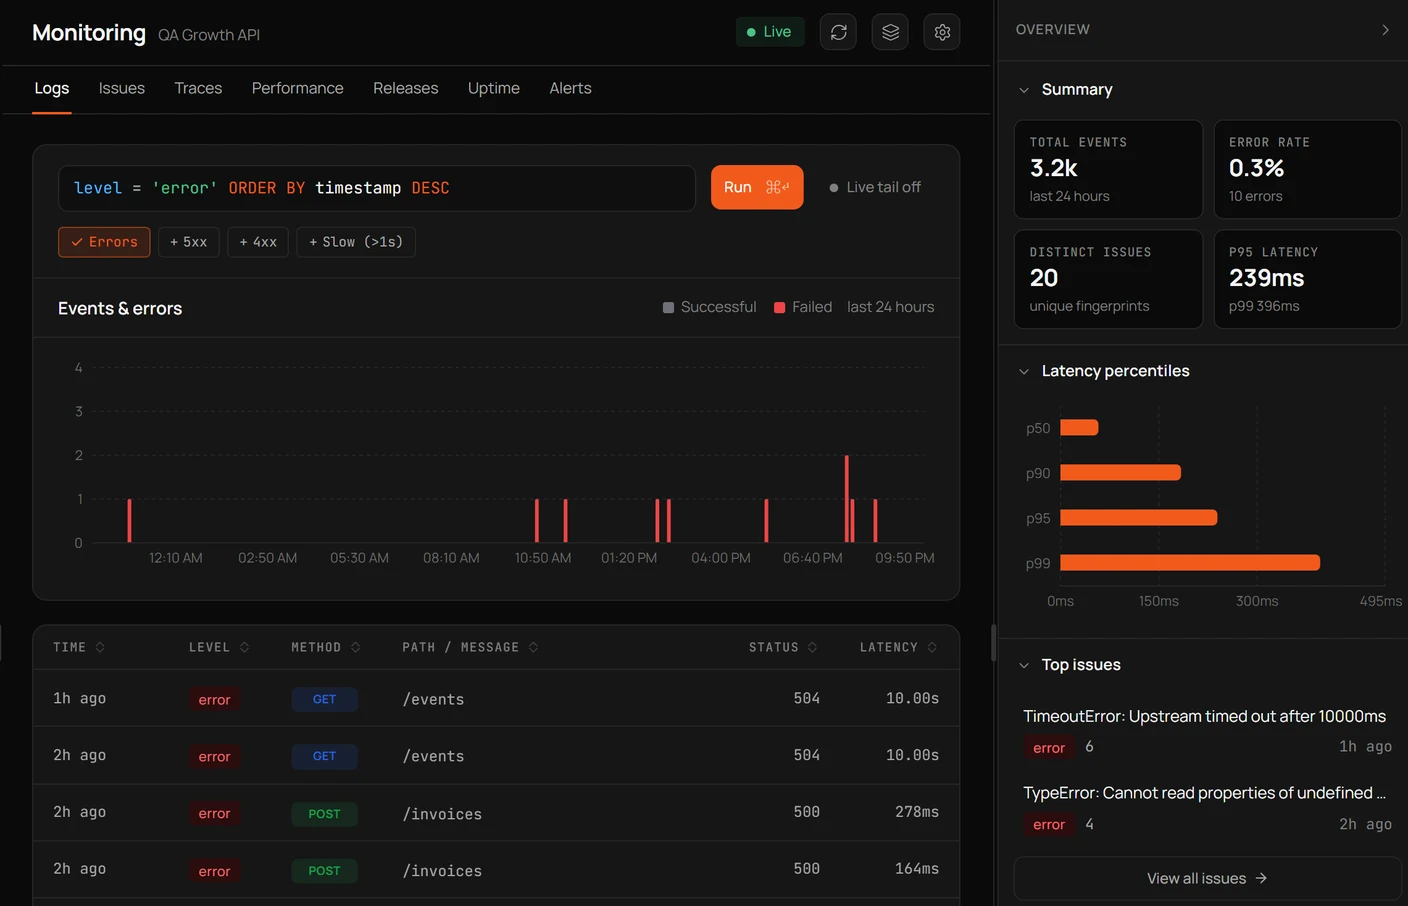
Suppose most API calls return in 30 ms, but one in twenty takes more than a second. The arithmetic mean may remain deceptively modest while a significant set of users encounters stalls. Keep distributions and report p50, p95, and p99 for important operations.
Measure the same boundary consistently. Client-observed response time includes connection and network costs; server-side duration often doesn't. A successful 200 that arrives after the caller's deadline should be visible as a client failure, not treated as unqualified success.
What to record for each request
Useful telemetry begins with a structured record that can join a customer report to the relevant service activity:
{
  "time": "2026-11-13T14:22:17Z",
  "request_id": "req_9b72",
  "trace_id": "6f8c...",
  "operation": "POST /orders",
  "status": 504,
  "duration_ms": 2010,
  "release": "2.5.0",
  "sdk_language": "python",
  "sdk_version": "1.4.0"
}
Record operation patterns instead of putting individual resource IDs into metric labels. Keep sensitive headers, tokens, and personal data out of telemetry by default. Where customer identifiers are necessary for investigation, protect them with appropriate access controls and retention limits.
Correlating by request ID or trace ID helps turn an abstract error rate into a specific investigation without searching an entire log stream by time.
Alerts worth acting on
Page someone for sustained user-visible failure: error rate exceeding an appropriate threshold, a latency SLO breach, or repeated failed external checks. Alert on new error fingerprints or regressions separately, especially after a release.
Every alert should identify its affected operation, the size of the problem, when it began, and where to inspect it. A notification that cannot lead to a sensible action will eventually be ignored.
API monitoring, testing and observability
Testing asks whether a known scenario works before or during release. Monitoring asks whether the deployed service is meeting its targets. Observability helps diagnose unexpected failures using events, logs, and traces. All three complement one another.
A comprehensive test suite cannot simulate every customer's network path or SDK version, and a green uptime check doesn't prove that all real requests succeed. Instrument production with those blind spots in mind.
Checklist for API monitoring
- Monitor real API operations as well as a public health endpoint.
- Collect the four golden signals and error distributions.
- Report latency percentiles, not only averages.
- Capture SDK and client-side timeouts where possible.
- Group by operation, release, region, and relevant caller version.
- Attach request and trace IDs for investigation.
- Redact credentials and sensitive input before storage.
- Create actionable alerts, and verify their delivery and recovery behavior.
- Keep a public status page for incidents customers need to know about.
API monitoring with Octri
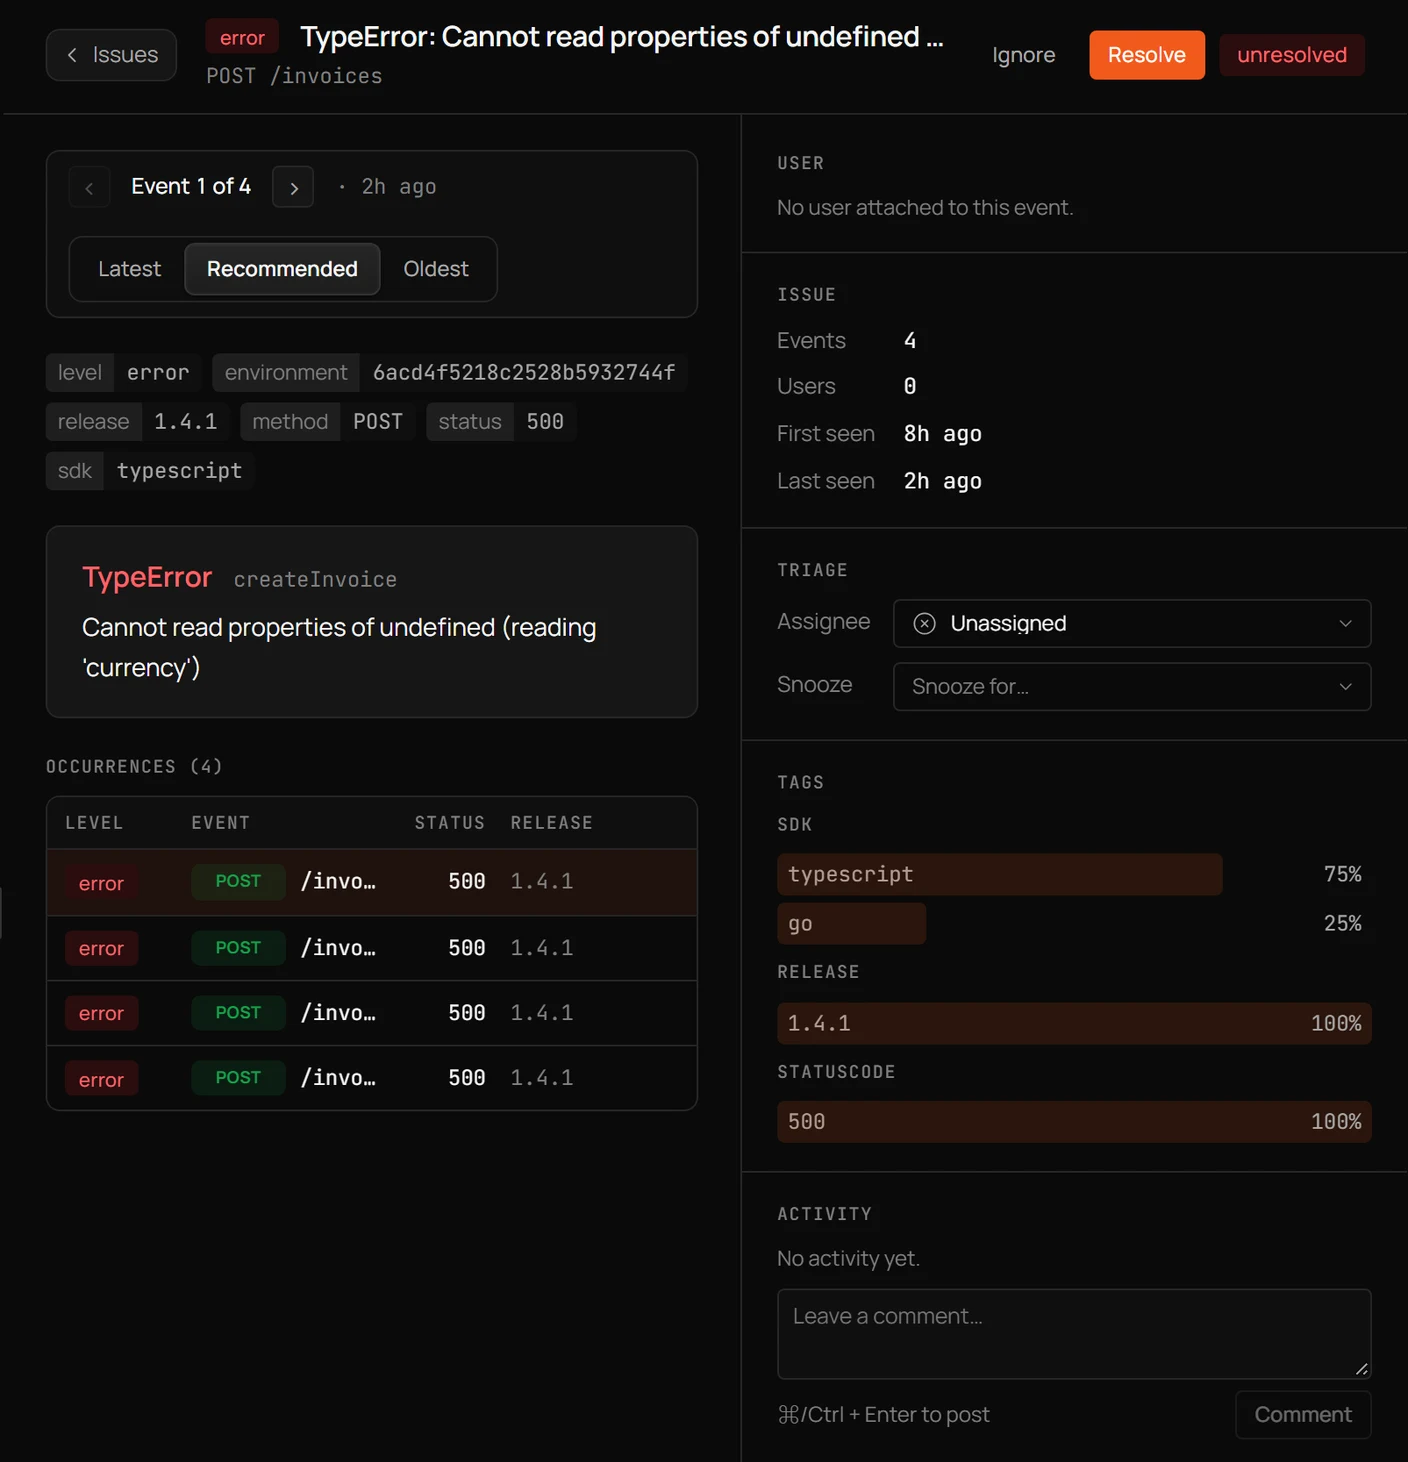
Octri Monitoring combines API and generated-SDK telemetry with searchable events, issue grouping, traces, uptime checks, and alerts. SDK-side reporting can reveal a timeout that the server did not record as a failure, while release and version tags help identify a narrow regression.
Uptime checks can be generated for suitable routes from an OpenAPI specification, and a public status page communicates incidents. The strongest setup uses these checks alongside the records of real client requests, so the dashboard reflects both reachability and actual service quality.