By the Octri team · Updated
What is API latency? Phases, p95 and p99, and latency vs response time
A request that returns 200 has only answered one question: did the server ultimately succeed? For someone waiting on a checkout screen, the second question is how long it took. A technically successful response can still arrive too late to be useful.
API latency is measured at a particular boundary, so any useful number has to say where the clock started and stopped. From the client, it includes more than the application's handler time.
What is API latency?
Latency is the elapsed time associated with an API request. In everyday API monitoring, people often use it interchangeably with response time, but the exact measurement matters: client-observed duration includes connection and network costs, while server handling time starts after the request reaches the application.
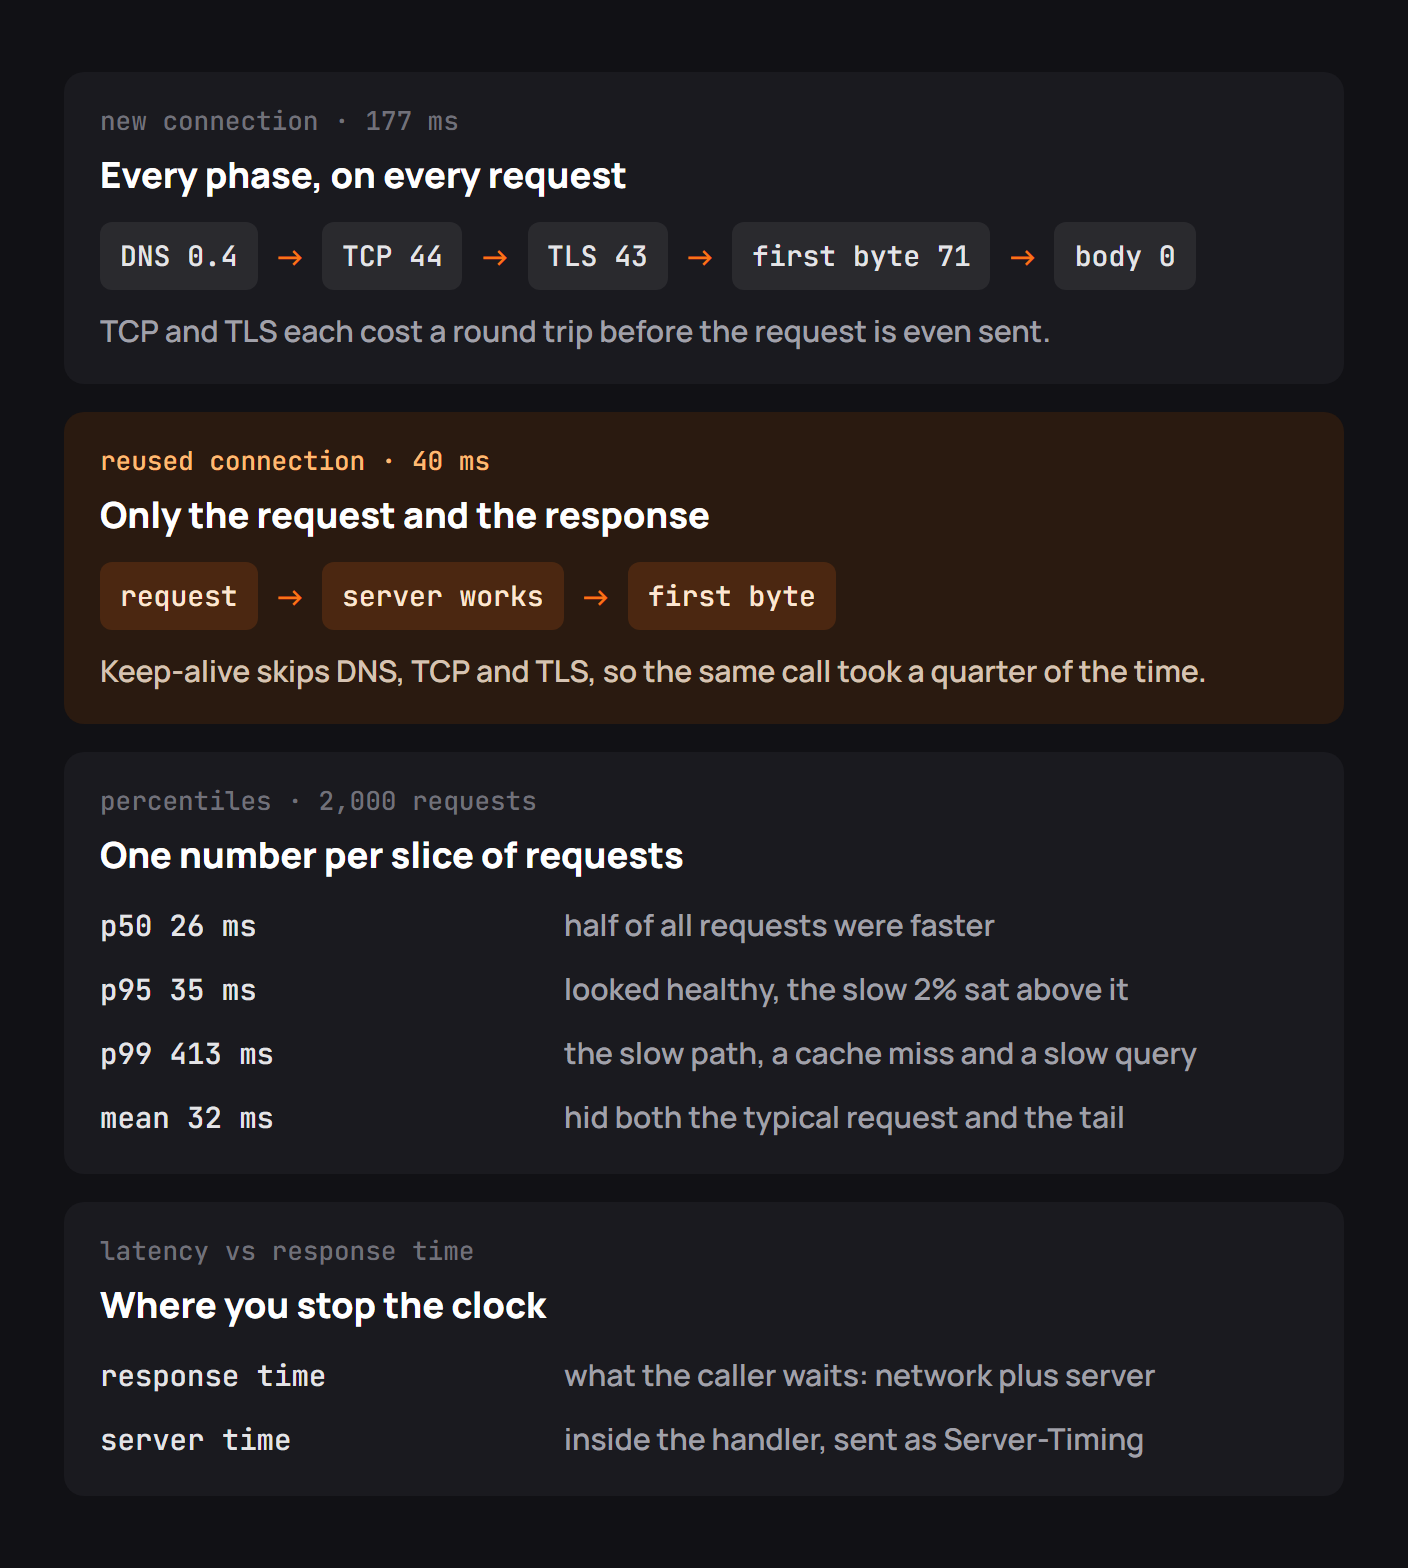
A new HTTPS connection may involve DNS lookup, TCP connection setup, TLS negotiation, request transfer, server work, and response transfer. The browser's Resource Timing API exposes timestamps for several of these phases. Server-side spans show what happens after the request reaches your infrastructure.
One request, phase by phase
Think of an endpoint called by a browser for the first time after a page loads. Before the server can begin work, the client may need to resolve a hostname and establish an encrypted connection. A later request can reuse that connection, avoiding much of the setup.
| Phase | What to inspect | Typical remedy |
|---|---|---|
| DNS | Lookup time and resolver failures | Correct caching and DNS configuration |
| TCP/TLS | New connections and handshake duration | Connection reuse, HTTP/2 or HTTP/3 where supported |
| Time to first byte | Server work plus transport until first response byte | Traces and application profiling |
| Response transfer | Payload size and link speed | Smaller response bodies, compression, pagination |
This distinction helps avoid optimizing the wrong part of the stack. A faster SQL query will not solve a 300 ms TLS handshake, and persistent connections won't solve a 600 ms query.
p50, p95 and p99
An average tells you how much time all calls consumed in total. It can conceal a serious problem for a small fraction of callers. Percentiles preserve more of the shape of the experience.
- p50 is the median. Half of requests were faster; half were slower.
- p95 is the threshold beneath which about 95% of calls fall.
- p99 reveals the slower 1% and is often where overloaded dependencies appear first.
I ran 400 requests against a local HTTP server that intentionally delayed every fortieth response. Most handlers waited about 6 ms; one in forty waited about 120 ms. From the client, that particular run measured roughly 48 ms at p50 and p95, but 164 ms at p99. The client-side overhead and local HTTP behavior affected the absolute values, so I would not reuse them as an Internet performance benchmark. The separation between the ordinary requests and the tail was the repeatable observation.
import statistics
import time
from urllib.request import urlopen

# Substitute your own safe GET endpoint in a test environment.
url = "https://api.example.com/health"
durations_ms = []
for _ in range(100):
    start = time.perf_counter()
    with urlopen(url, timeout=5) as response:
        response.read()
    durations_ms.append((time.perf_counter() - start) * 1000)

ordered = sorted(durations_ms)
print("median", statistics.median(ordered))
print("p95", ordered[int(len(ordered) * 0.95) - 1])
print("p99", ordered[int(len(ordered) * 0.99) - 1])
Choose a consistent percentile calculation method, especially for small samples. A percentile for a low-traffic endpoint can move significantly when just one request arrives.
Why the tail matters more than it looks
Many application pages wait for several API calls. If ten independent calls each have a 1% chance of exceeding a latency threshold, the chance that at least one exceeds it is:
1 - (1 - 0.01)^10 = 9.56%So a page with ten calls can feel slow much more often than the p99 of any one endpoint suggests. The independence assumption is not always true, since network congestion can slow several calls together. Even so, the example shows why small tail probabilities deserve attention.
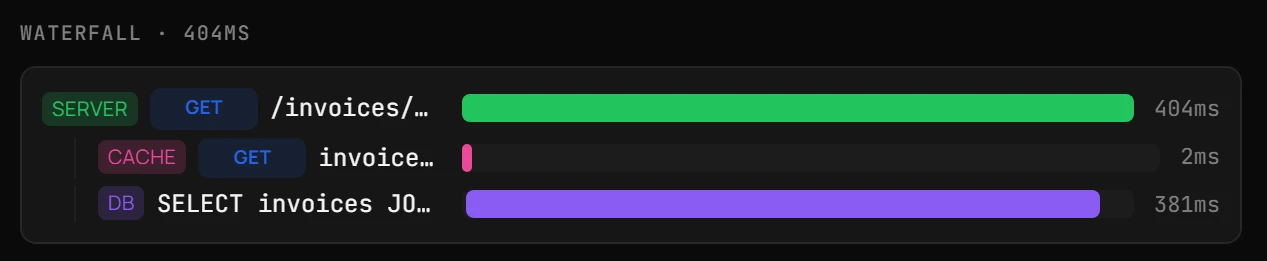
A trace can identify which call took the slow path. If a cache miss is followed by a long database span, improving that branch is more valuable than shaving a millisecond from every successful cache hit.
Latency vs response time
In dashboards, the labels are sometimes used loosely. Document the boundary alongside the metric. Server duration is how long the application spent processing. Time to first byte is when the first response byte became available to the caller. End-to-end response time lasts until the body is received, and may include redirects, retries, connection setup, and the network.
Also separate successful requests from fast errors. A service that immediately returns 500 can report excellent average latency while failing every user. Measure success rate and latency together.
How to reduce API latency
Start with evidence: group p95 and p99 by endpoint, release, region, SDK, and request size. Open representative slow traces. Check saturation, queueing, database queries, external calls, and retry behavior before proposing changes.
The common improvements are connection reuse, caching expensive reads, batching queries, shrinking responses, keeping database indexes current, and placing timeouts around dependencies. But each technique has trade-offs: caching introduces freshness concerns, retries increase load, and longer timeouts can occupy scarce workers.
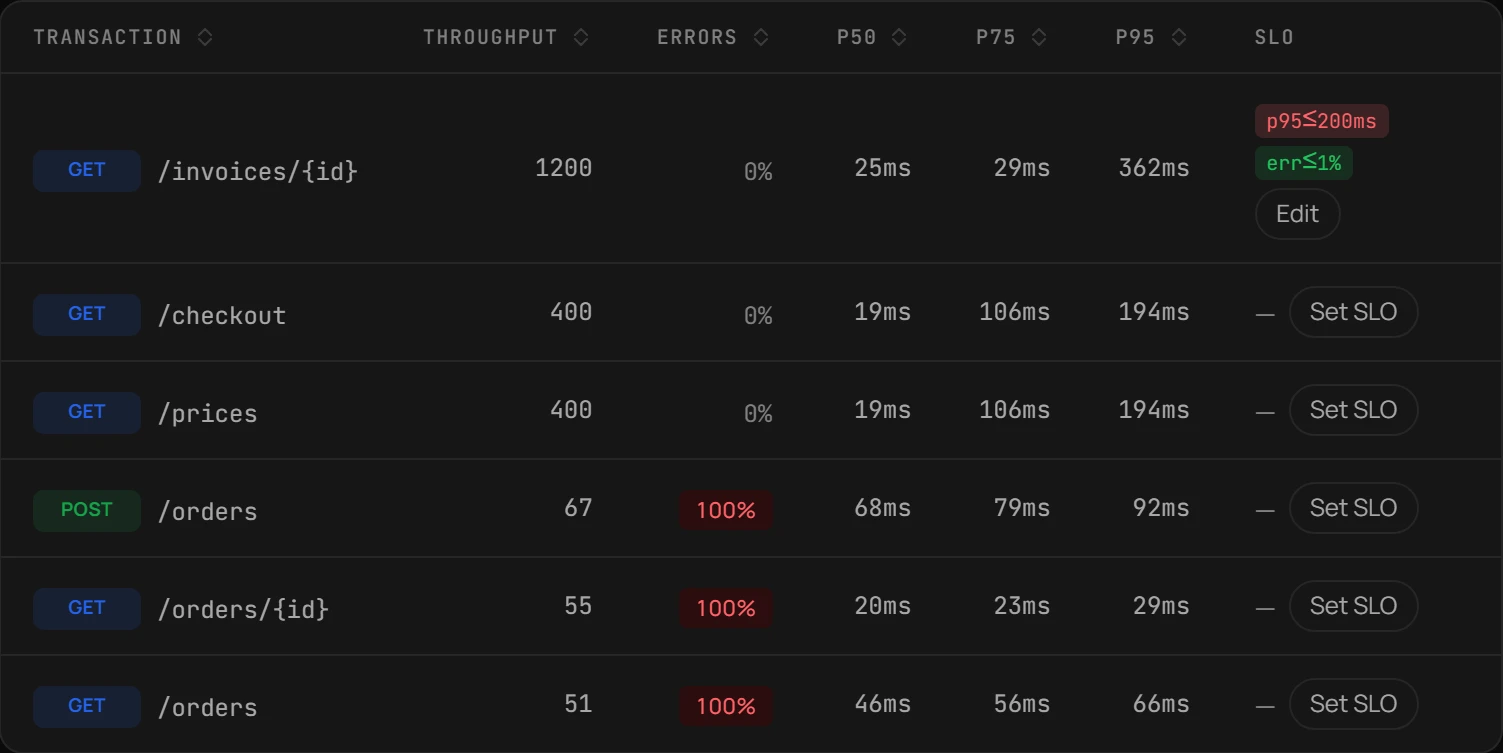
Choose a latency SLO that reflects your users' task, such as “95% of successful checkout requests complete within 300 ms,” not an arbitrary round number. A regional or SDK-specific regression should be visible even when the global p95 remains below target.
Checklist for API latency
- State exactly where every latency measurement starts and stops.
- Track p50, p95, and p99 per important operation.
- Separate failed from successful responses.
- Capture connection, server, and dependency timing when available.
- Compare slow calls by release, region, and client version.
- Open traces to locate cache misses and repeated queries.
- Set a user-facing latency SLO and alert on sustained breaches.
- Re-measure after changes using comparable traffic.
API latency with Octri
Octri Monitoring shows latency distributions by API transaction, along with errors and throughput. Backend instrumentation can turn a slow request into a waterfall of database and outbound calls, while generated SDK telemetry records the caller's side of failed requests. Those two perspectives help distinguish a slow server from a timeout that occurred before the server logged an error.
Latency SLOs can be attached to transactions, and slow traces can be investigated alongside their releases and issues. The important step is to follow the actual request path before deciding which part needs to be faster.