By the Octri team · Updated
What is an API status page? What it shows, and what its bars hide
When an API starts failing, developers often spend their first few minutes debugging their own integration. They rotate credentials, retry with cURL, and check the latest deployment before realizing the provider may be having trouble. An API status page exists to shorten that uncertainty.
It also creates an obligation: once you tell users where to look, that page has to remain available and explain more than a row of green or red indicators.
What is an API status page?
An API status page is a public record of the service's current condition and recent incidents. It normally combines current component health, active incident updates, a history of uptime checks, maintenance announcements, and a way to subscribe to changes.
The reader wants to answer practical questions: Is the API failing for everyone or only one operation? Are webhooks delayed? Should I retry now? Has the provider acknowledged the problem? What will they say next?
A useful page separates those answers. Component status identifies the affected surface. Incident updates give the timeline, impact, and next communication. Historical uptime shows patterns over weeks rather than describing one incident in detail.
What a day's uptime bar hides
A bar typically compresses 24 hours into one color. That is convenient for scanning ninety days of history, but it can conceal important differences. A one-minute outage leaves a daily uptime figure around 99.93%. A two-minute complete outage produces about 99.86%. Three hours of partial failure can result in a similar warning color.
These are different experiences for customers. A red checkout for two minutes during a deployment may affect a narrower population than degraded payments for an entire afternoon. The color can't carry that context.
The diagram below comes from an illustrative 90-day monitoring simulation, not a real provider's incident record. It shows how two-minute and 25-minute outages can both render as amber daily bars, and how a monitor that checks every five minutes can miss a brief failure or round its duration to the full interval.
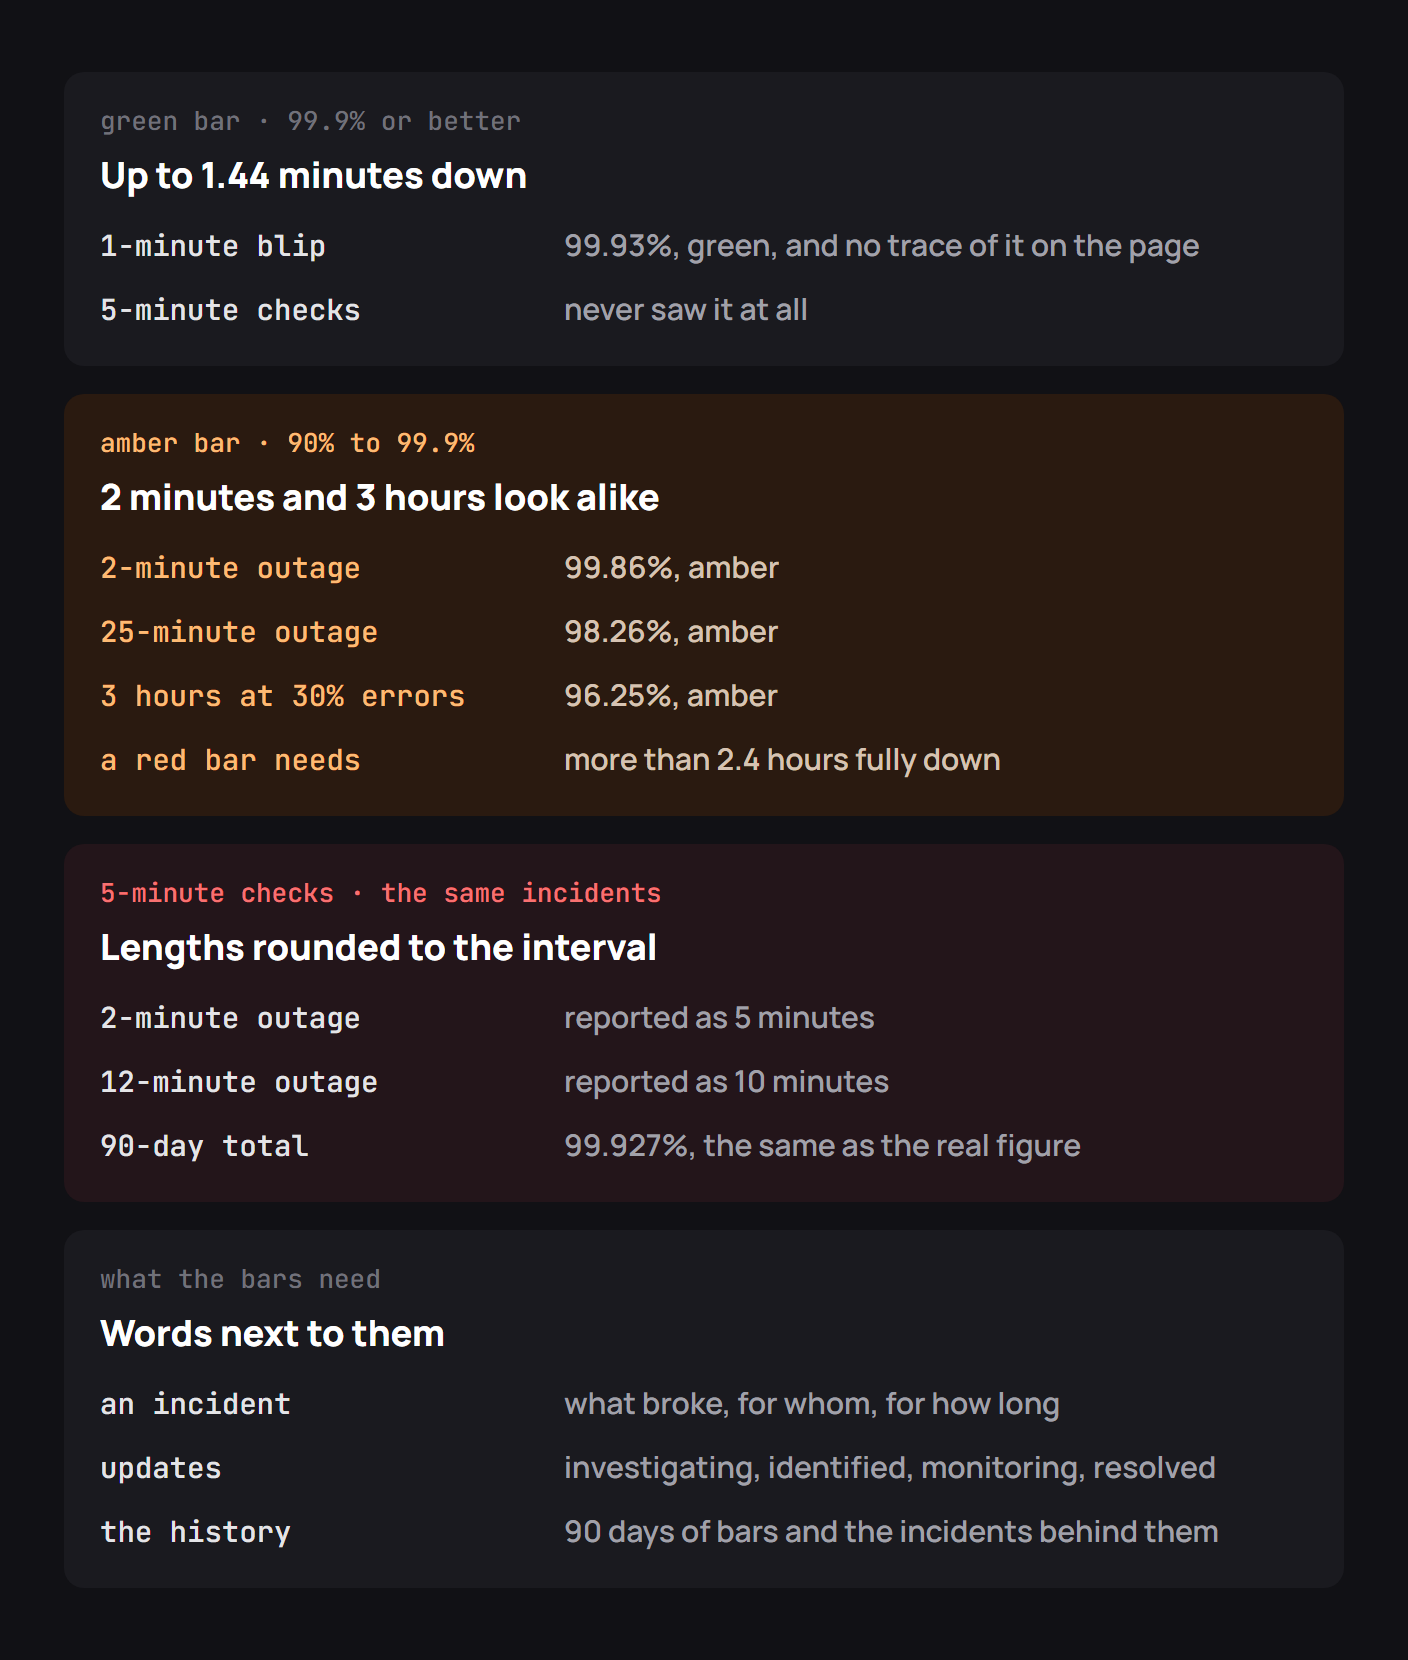
Uptime calculations should say what was measured: a synthetic request every minute, successful production requests, or the share of time an endpoint returned an acceptable status. A bar without its measurement method is easy to misunderstand.
How to write incident updates
Atlassian describes its actual practice in its incident response handbook. The company uses separate Statuspage instances for internal staff and external customers. The internal channel carries more operational detail, while the public page communicates impact and progress without requiring a customer to understand the entire incident room.
The handbook also explains that initial communication happens promptly, before engineers necessarily know the root cause. Atlassian's teams use established templates, then update the public incident as it moves through its lifecycle. That division of work matters: an engineer diagnosing the system and a person explaining the outage to customers have different immediate tasks.
A concise incident might develop like this:
| Stage | Example update |
|---|---|
| Investigating | “Some customers are receiving 5xx responses from the Orders API. We are investigating.” |
| Identified | “A database connection issue is affecting order creation; order reads remain available.” |
| Monitoring | “We have reduced the errors and are monitoring recovery before marking this resolved.” |
| Resolved | “Order creation has returned to normal. We are reviewing the incident and will publish follow-up details.” |
Don't invent an ETA to make the update sound complete. State when the next update is expected, even if the technical cause is still unknown. Readers prefer a reliable update schedule to silence.
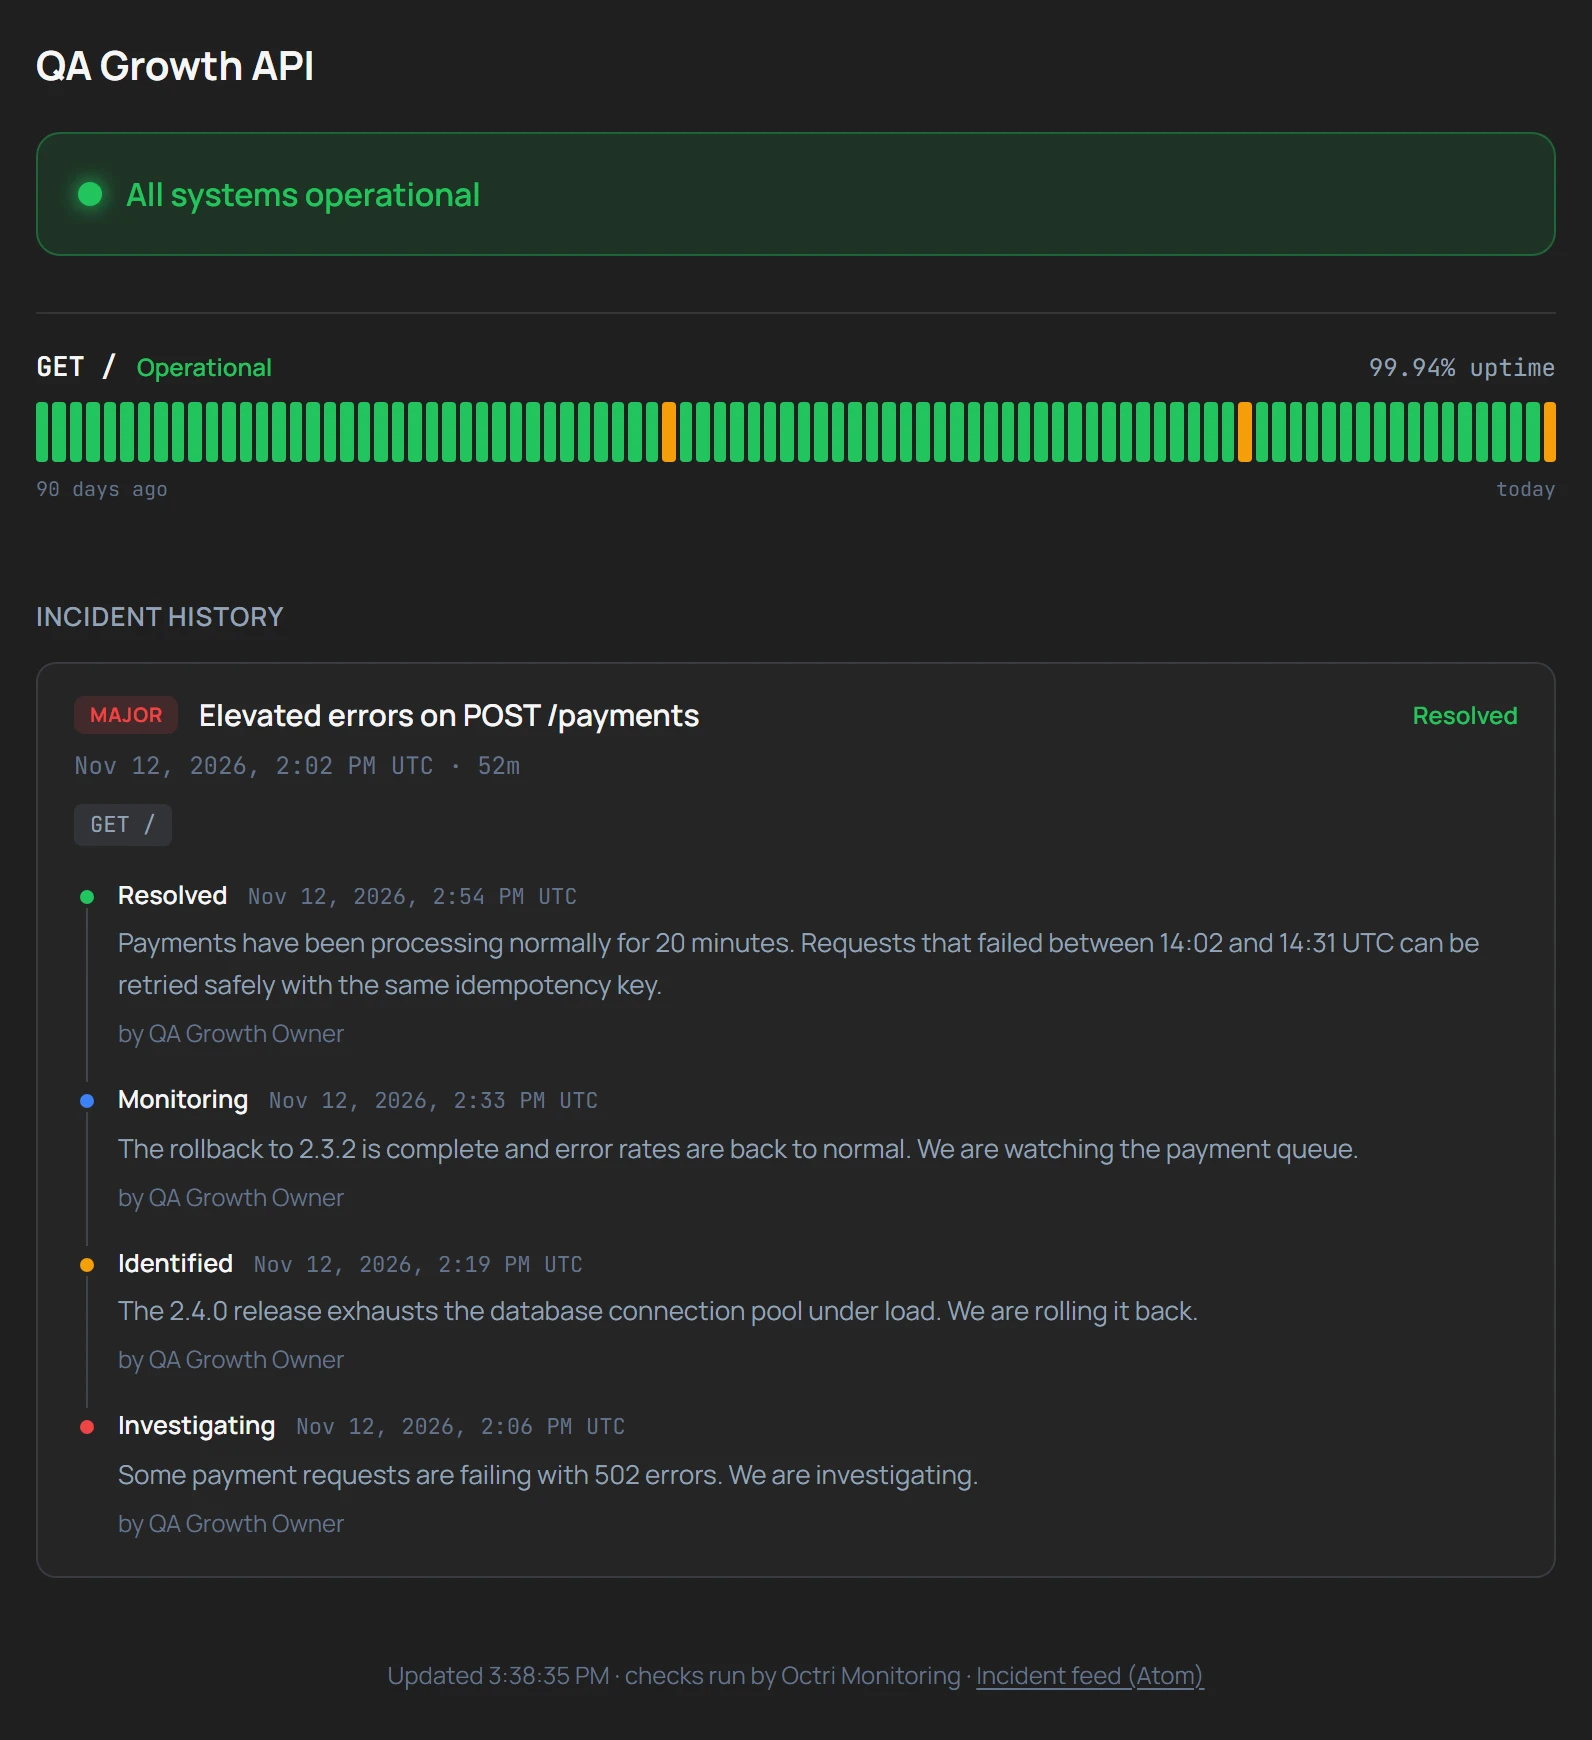
The strongest incident pages link symptoms to a specific component and communicate what users should do. If requests may have succeeded despite timeouts, mention how to check before retrying. If a webhook backlog is draining, explain that events may arrive late even though the service is responding again.
Host it apart from your API
A status page hosted entirely inside the same infrastructure as the failing service may disappear when it is needed most. Keep its hosting, DNS, and publishing path independent enough that an application outage doesn't prevent communication.
Also separate the status page's health signal from its human-written explanation. Monitoring may automatically mark a component degraded, but the incident commander must still explain what that means to users. A healthy check on one endpoint does not justify claiming that every feature works.
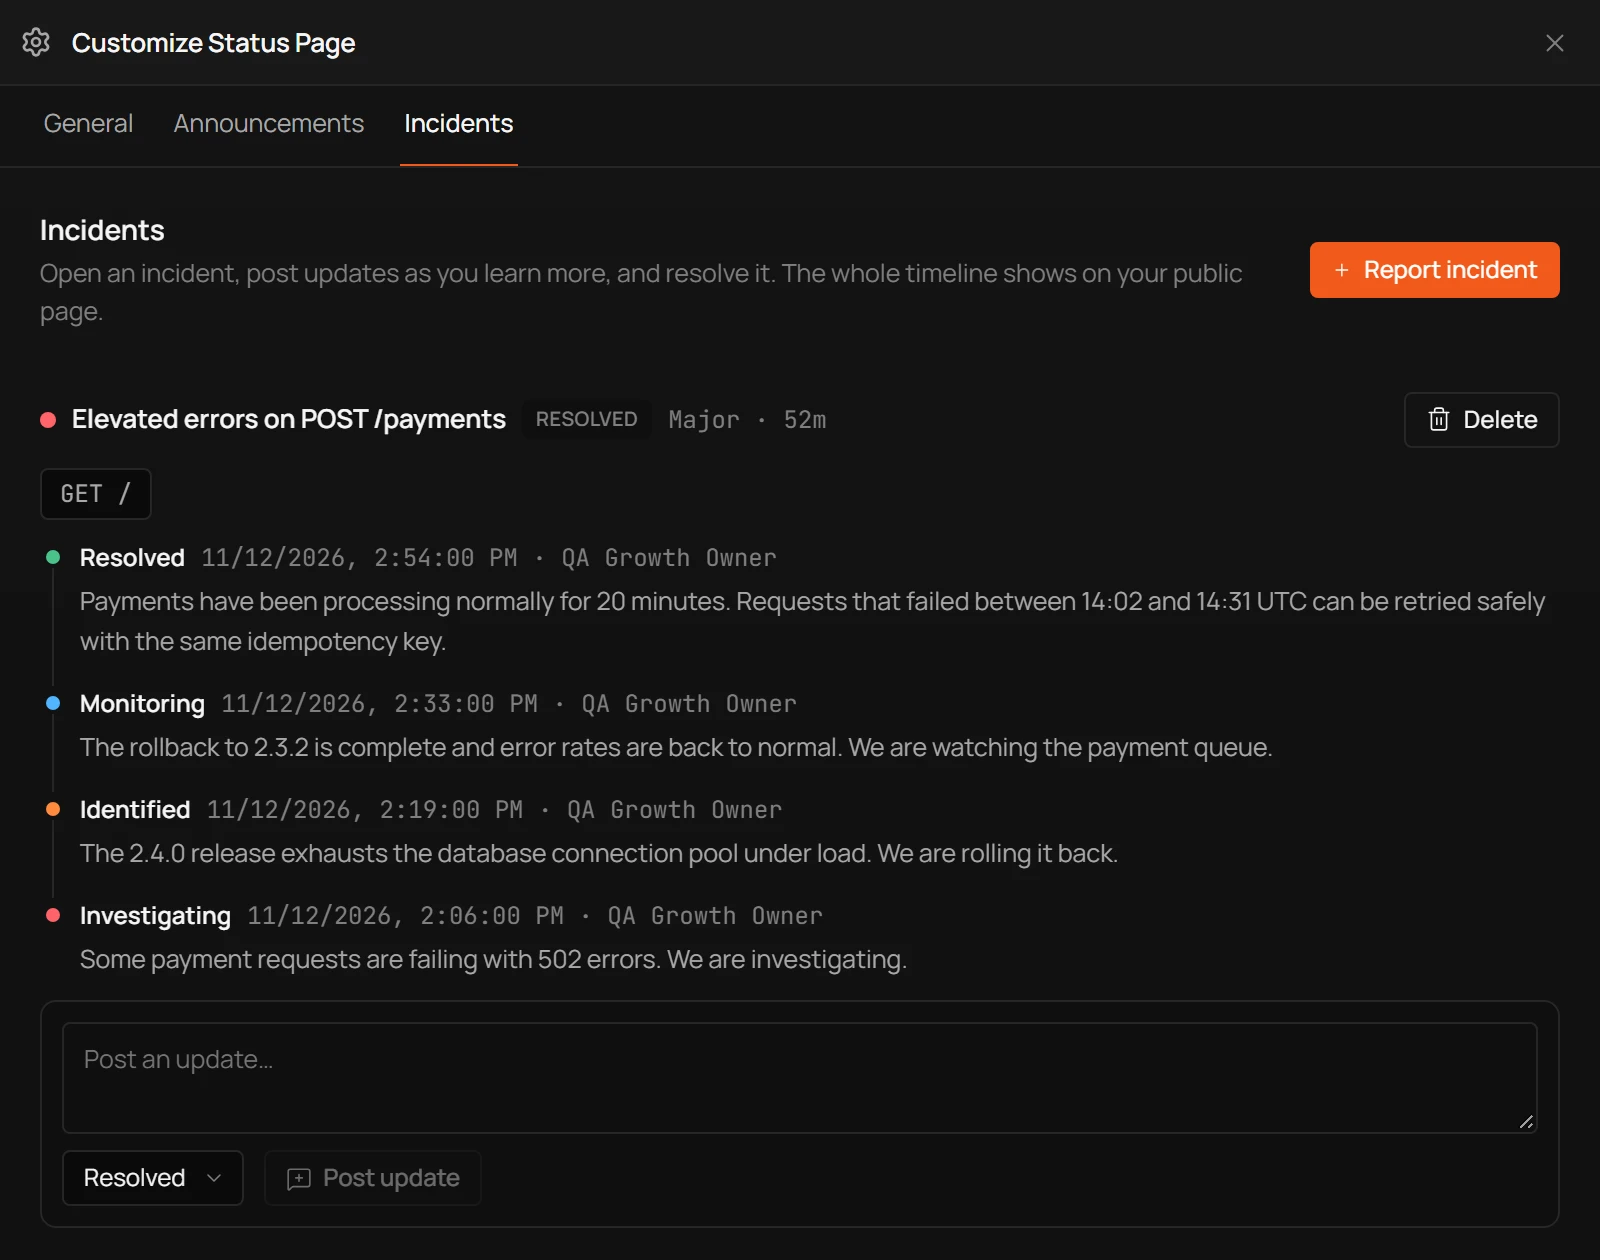
Add a feed or subscription path, such as email, webhook, or Atom/RSS, so consumers can learn about incidents without repeatedly refreshing the page. Planned maintenance belongs in the same place, with an advance window and a clear description of possible effects.
Checklist for an API status page
- Show current overall health and the status of individual API components.
- Publish updates promptly, even when the cause is still unknown.
- Describe customer impact and what to do next.
- Put timestamps and time zones on every incident update.
- Explain how uptime is measured and how frequently checks run.
- Keep historical incidents accessible behind daily uptime summaries.
- Offer subscriptions and planned-maintenance notices.
- Host the page independently from the service it describes.
- Close incidents only after monitoring confirms recovery.
API status pages with Octri
Octri Monitoring can publish a status page for configured uptime checks, with component health, a 90-day uptime history, incident timelines, and announcements. Incidents can move through investigating, identified, monitoring, and resolved states, and visitors can follow updates through an Atom feed. The status page can be served independently of your API.
The uptime checks provide the facts about reachability. The incident updates supply the explanation: which customers are affected, whether work should be retried, and when to expect another update. Both are necessary for a page people can trust during an outage.