By the Octri team · Updated
Logs vs metrics vs traces: what each records, costs and answers
A failed API request leaves several kinds of evidence. One system counts how many requests failed. Another records the specific error. A third shows which services and database calls the request passed through. They can all be accurate and still tell very different stories.
That is the practical difference between logs, metrics, and traces. They each preserve a different amount of context, and each makes a different question cheap to answer.
What is the difference between logs, metrics and traces?
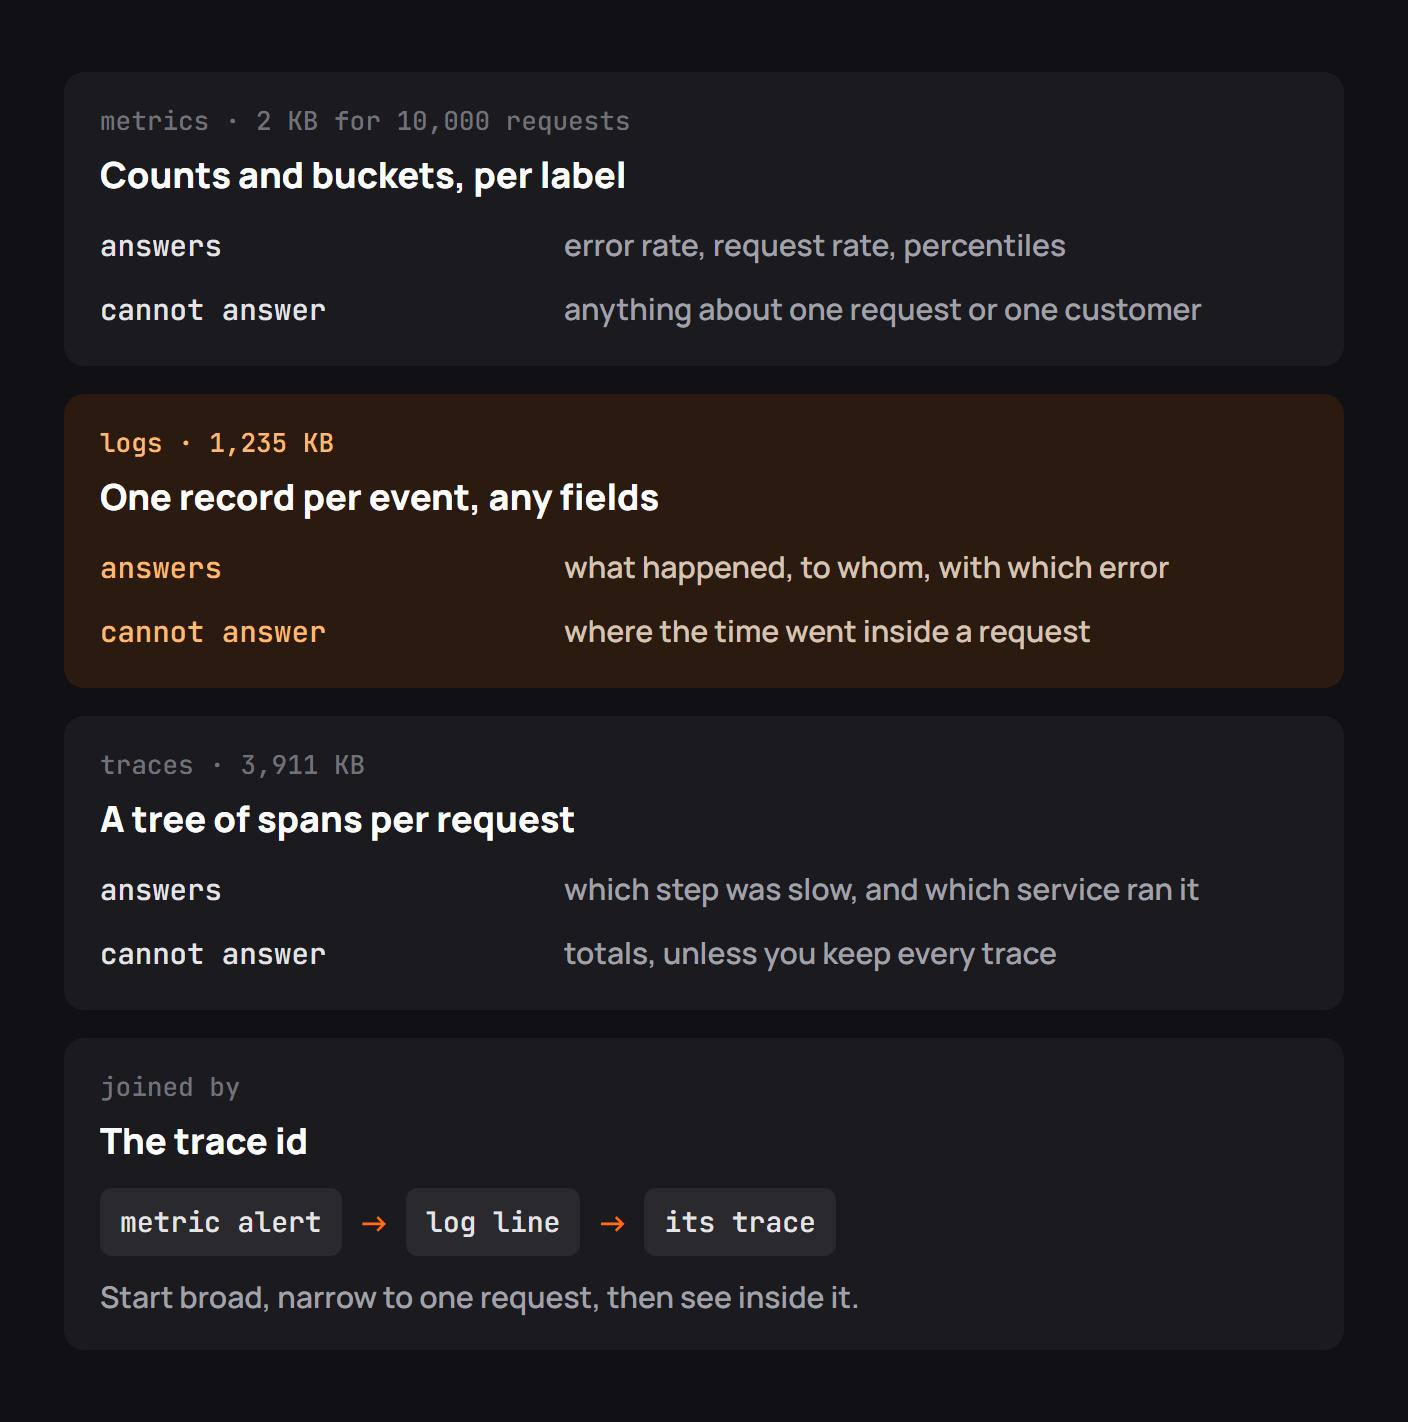
A metric is a number accumulated over time: requests, failures, latency buckets, or active connections. A log is an event with a timestamp and fields chosen by the application. A trace connects the spans of one operation across components, with timing and parent-child relationships.
| Signal | Natural question | What it loses |
|---|---|---|
| Metrics | How often is POST /orders failing? |
Individual request context unless encoded as labels |
| Logs | What error did this customer encounter? | The sequence of operations unless correlated |
| Traces | Which service and query made this request slow? | Cheap system-wide totals if sampling discards most traces |
The most useful design gives each event enough shared identity to move between them: operation, release, and a trace or request ID where relevant. You shouldn't have to guess which log belongs to a trace.
The same 10,000 requests, recorded three ways
I recorded a smaller controlled sample to make the storage difference visible. Five hundred synthetic requests generated one JSON log event per request, two trace spans per request, and a handful of aggregate metric counters. Written without compression or a production backend, the files came out as follows:
| Data | Records | File size in my local run |
|---|---|---|
| Metric counters | 4 time-series entries | 230 bytes |
| Structured logs | 500 events | 65,233 bytes |
| Trace spans | 1,000 spans | 84,554 bytes |
The numbers aren't benchmarks for observability vendors; real systems batch, compress, sample, and index differently. They illustrate why a metric remains economical as traffic grows while a per-request record grows with the number of requests, and why a request with dozens of spans can be expensive to retain in full.
Metrics: cheap, fast, and only as detailed as their labels
A counter such as http_requests_total can answer the error rate without reading individual events:
http_requests_total{route="POST /orders",status="200"} 247
http_requests_total{route="POST /orders",status="500"} 3
For latency, use histograms rather than averages alone. A histogram lets you estimate p95 and p99 from observed buckets; its accuracy depends on where those bucket boundaries fall. Metrics are excellent for dashboards and alerts precisely because they do not need to preserve every request.
Don't add customer IDs or request IDs as metric labels. A thousand distinct customers multiplied by routes, methods, statuses, regions, and SDK versions can produce a huge number of time series. Put high-cardinality values in events and traces, where one additional value doesn't create a new metric series.
Logs: what happened, to whom
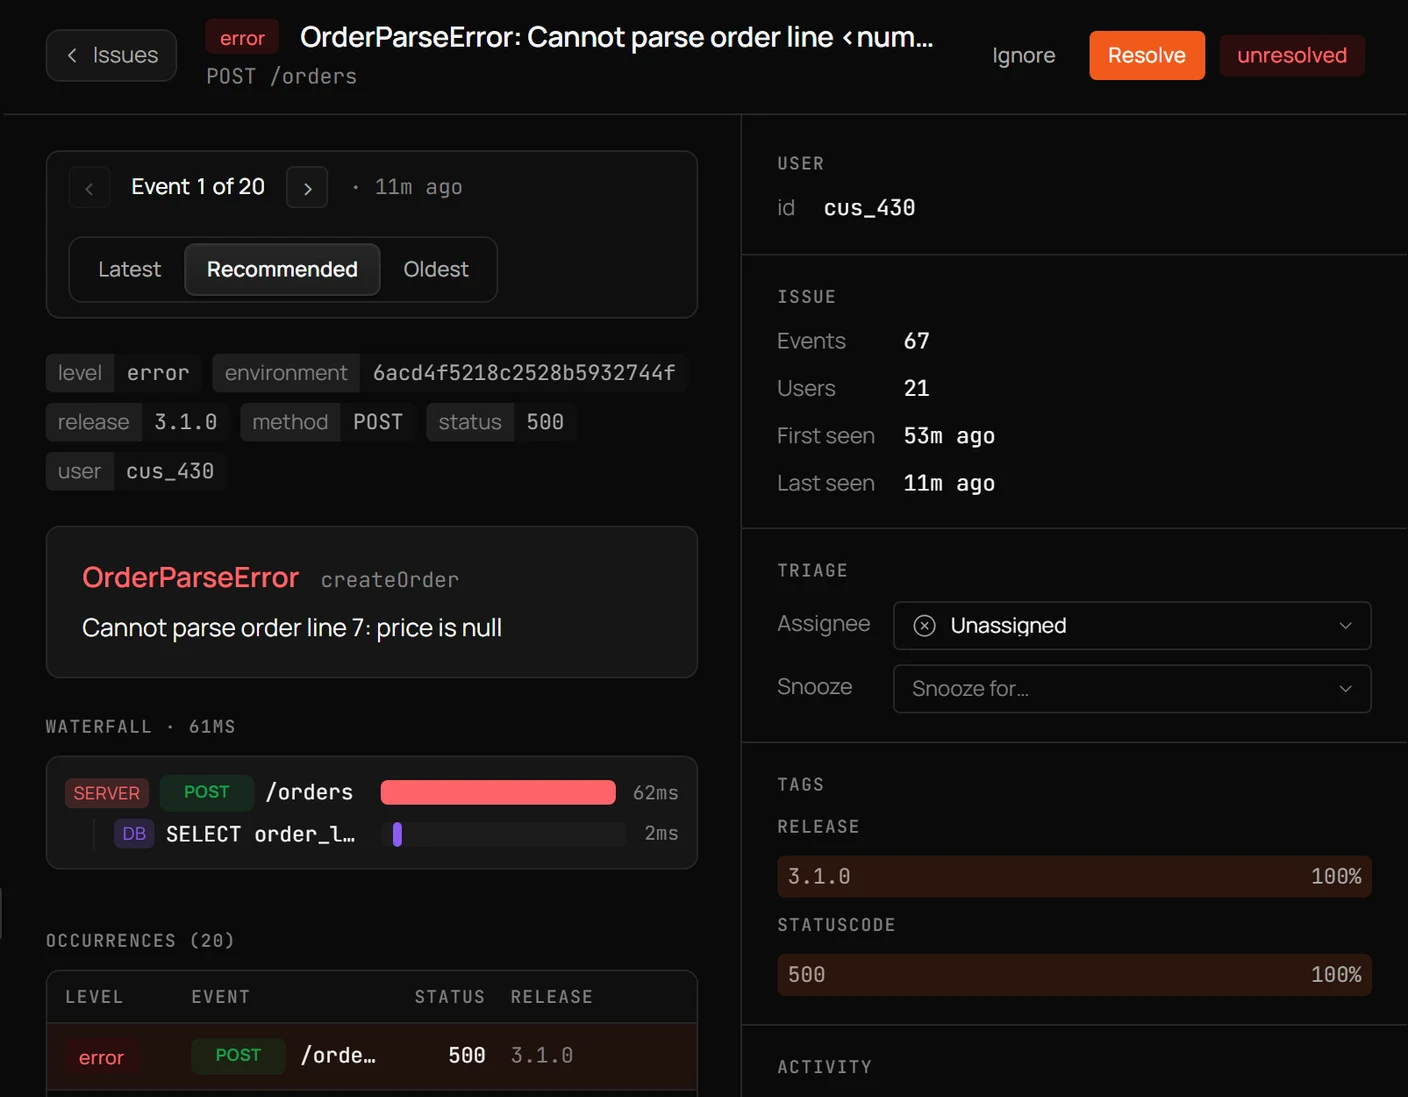
A structured event can contain fields that you could never economically add to every metric. For a failed request, the useful details are often request_id, trace_id, operation, status, release, sanitized error code, and relevant SDK version.
{
  "time": "2026-11-13T10:21:09Z",
  "trace_id": "1ad03e...",
  "operation": "POST /orders",
  "status": 422,
  "error": "unknown_customer_field",
  "sdk_version": "1.4.0"
}
The event can be grouped with similar failures or searched for one customer's support ticket. It cannot, on its own, show which database query was slow unless the application logged that detail too. Sensitive fields should be removed or masked before ingestion, not only hidden by the dashboard.
Traces: where the time went
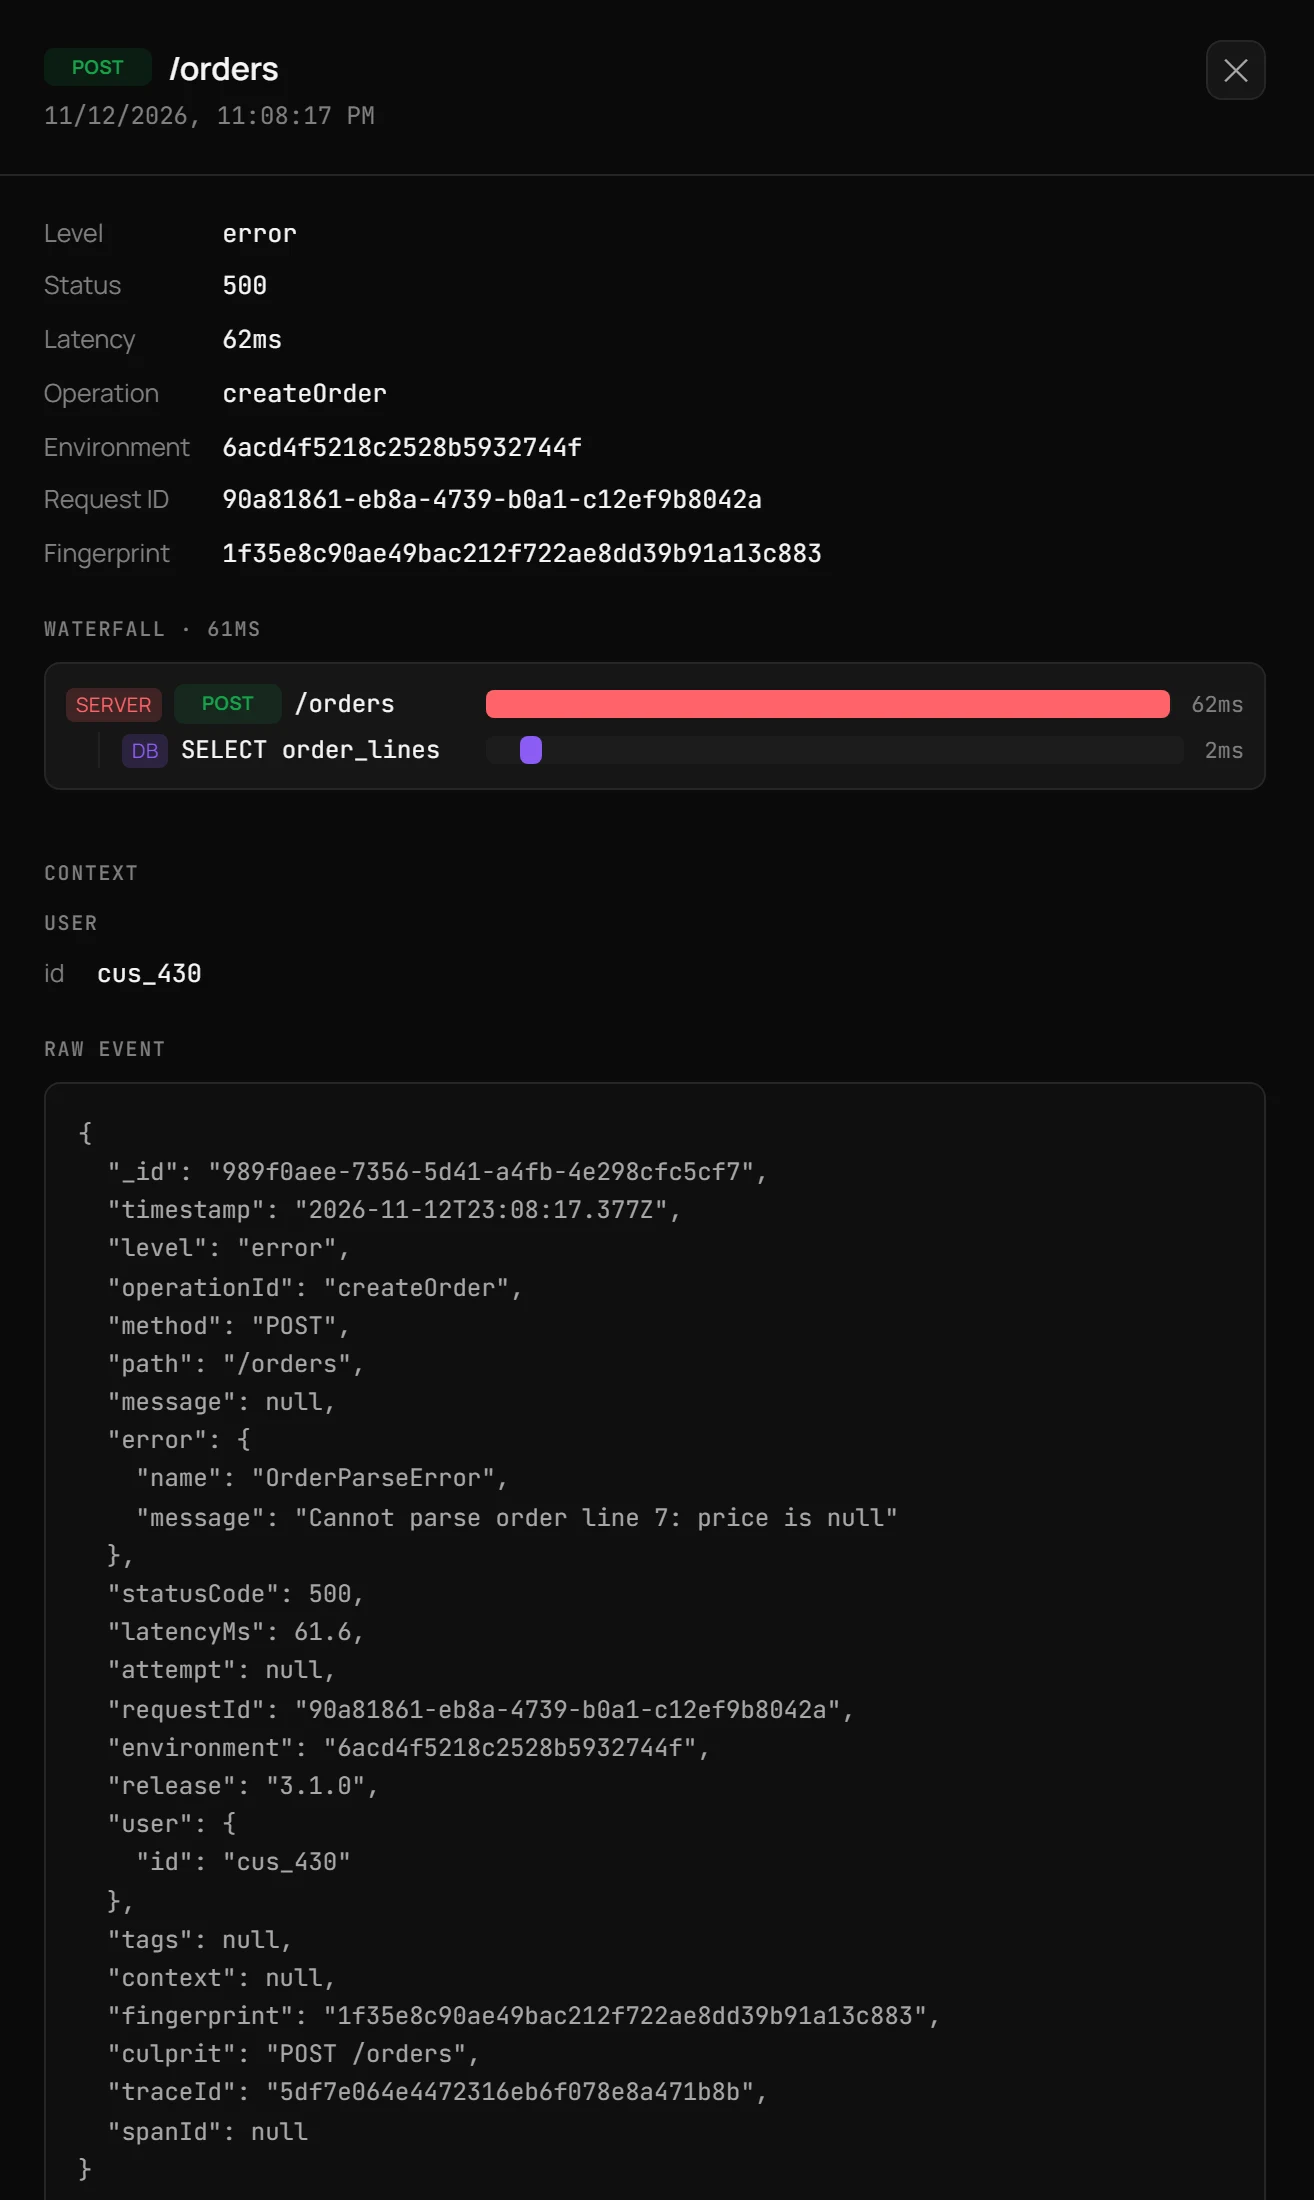
A trace is a tree of spans. In an order workflow, it might include the HTTP handler, a payment authorization, inventory lookup, and three database queries. The trace ID identifies the whole operation; each span has its own ID and parent. Distributed propagation usually uses the W3C traceparent header.
If the request takes 850 ms, a trace might reveal 700 ms waiting on a database call and only 20 ms in application code. A log telling you “slow request” cannot explain that distribution of time.
A trace also exposes repeated queries. Forty small database calls may be individually unremarkable, yet dominate the request because they run serially. This is why traces are useful for diagnosing the N+1 pattern and for distinguishing database time from network waits.
How to use them together
Suppose a metric alert shows a rising error rate on createOrder. Start with the metric to determine when it rose and how broad it is. Query logs to find the errors and versions that changed. Open one representative trace to see the failing dependency or code path.
Then return to the aggregate view to confirm the fix helped the whole affected population, not just the one request you inspected. Each signal should serve a different stage of the investigation.
OpenTelemetry can provide a shared way to instrument these signals, but a collector alone does not guarantee the data is useful. Naming conventions, consistent route attributes, correlation IDs, and deliberate sampling determine whether you can actually join them.
Checklist for logs, metrics and traces
- Use metrics for rates, volumes, percentiles, and alerts.
- Use structured logs for individual events and detailed error context.
- Use distributed traces for cross-service latency and dependency diagnosis.
- Propagate a trace ID and include it on relevant log events.
- Keep high-cardinality values out of metric labels.
- Redact secrets and personal data before recording telemetry.
- Document sampling decisions so missing traces are not mistaken for missing requests.
- Test an investigation by moving from a failing metric to a specific trace.
Logs, metrics and traces with Octri
Octri Monitoring connects request events, grouped issues, and trace waterfalls for an API and its generated SDKs. Logs can be filtered by the fields they carry; the Performance area aggregates latency and errors by transaction; traces reveal database and outbound-call spans when backend instrumentation is enabled.
A W3C traceparent header from a generated SDK can join a client request to the server's work. That connection matters most when the server reports success but the caller timed out, or when a small group of SDK versions is failing while the overall dashboard looks healthy.