By the Octri team · Updated
API monitoring vs observability: what each one does in an incident
When an API begins returning errors, your dashboards should tell you something is wrong before customers do. But an alert that says “search failures are high” cannot explain whether the problem came from a new release, a database, or one unexpected class of traffic.
API monitoring and observability serve different parts of that investigation. Monitoring recognizes a known symptom. Observability lets engineers explore enough context to understand a failure they didn't anticipate.
What is the difference between API monitoring and observability?
Monitoring asks questions you decided were important ahead of time: is the API reachable, are 5xx responses increasing, is p95 latency above its budget? It uses scheduled checks, aggregate metrics, known error conditions, and alert rules.
Observability is the ability to answer a new question about a running system from the telemetry it already emits. Instead of merely seeing error rate rise, an engineer can group the failing requests by SDK version, region, customer type, release, or dependency and follow representative traces.
| Monitoring | Observability | |
|---|---|---|
| Starts with | A known rule or target | A question raised by unexpected behavior |
| Common outputs | Alerts, availability reports, SLO dashboards | Searches, comparisons, traces, detailed issues |
| Needs | Counts, rates, percentiles, check results | Rich context on individual events and spans |
| Main value | Detect the problem promptly | Explain its scope and cause |
These aren't competing products or engineering philosophies. A useful system has both: an early signal and enough evidence to investigate it.
One incident, two views
A revealing example comes from GitHub's April 2026 availability report. On April 27, GitHub's search services degraded when the load-balancing tier in front of search became saturated. Automated monitoring detected a drop in results and the team declared an incident at 16:21 UTC, six minutes after the reported start of impact.
The difficult part came after detection. During the investigation, the team found a large volume of anonymous distributed scraping traffic designed to avoid public API rate limits. According to GitHub's report, it accounted for 30% of that day's search traffic, concentrated into four hours, and came from more than 600,000 unique IP addresses. Existing monitoring hadn't classified that pattern as a risk. Engineers identified it while working to mitigate the incident.
The monitoring was useful: it showed customer-visible failure quickly. The investigation needed something else: enough traffic attributes and infrastructure context to connect those failures to saturation and unusual caller behavior. GitHub subsequently described new monitors and controls for this traffic as part of its follow-up work.
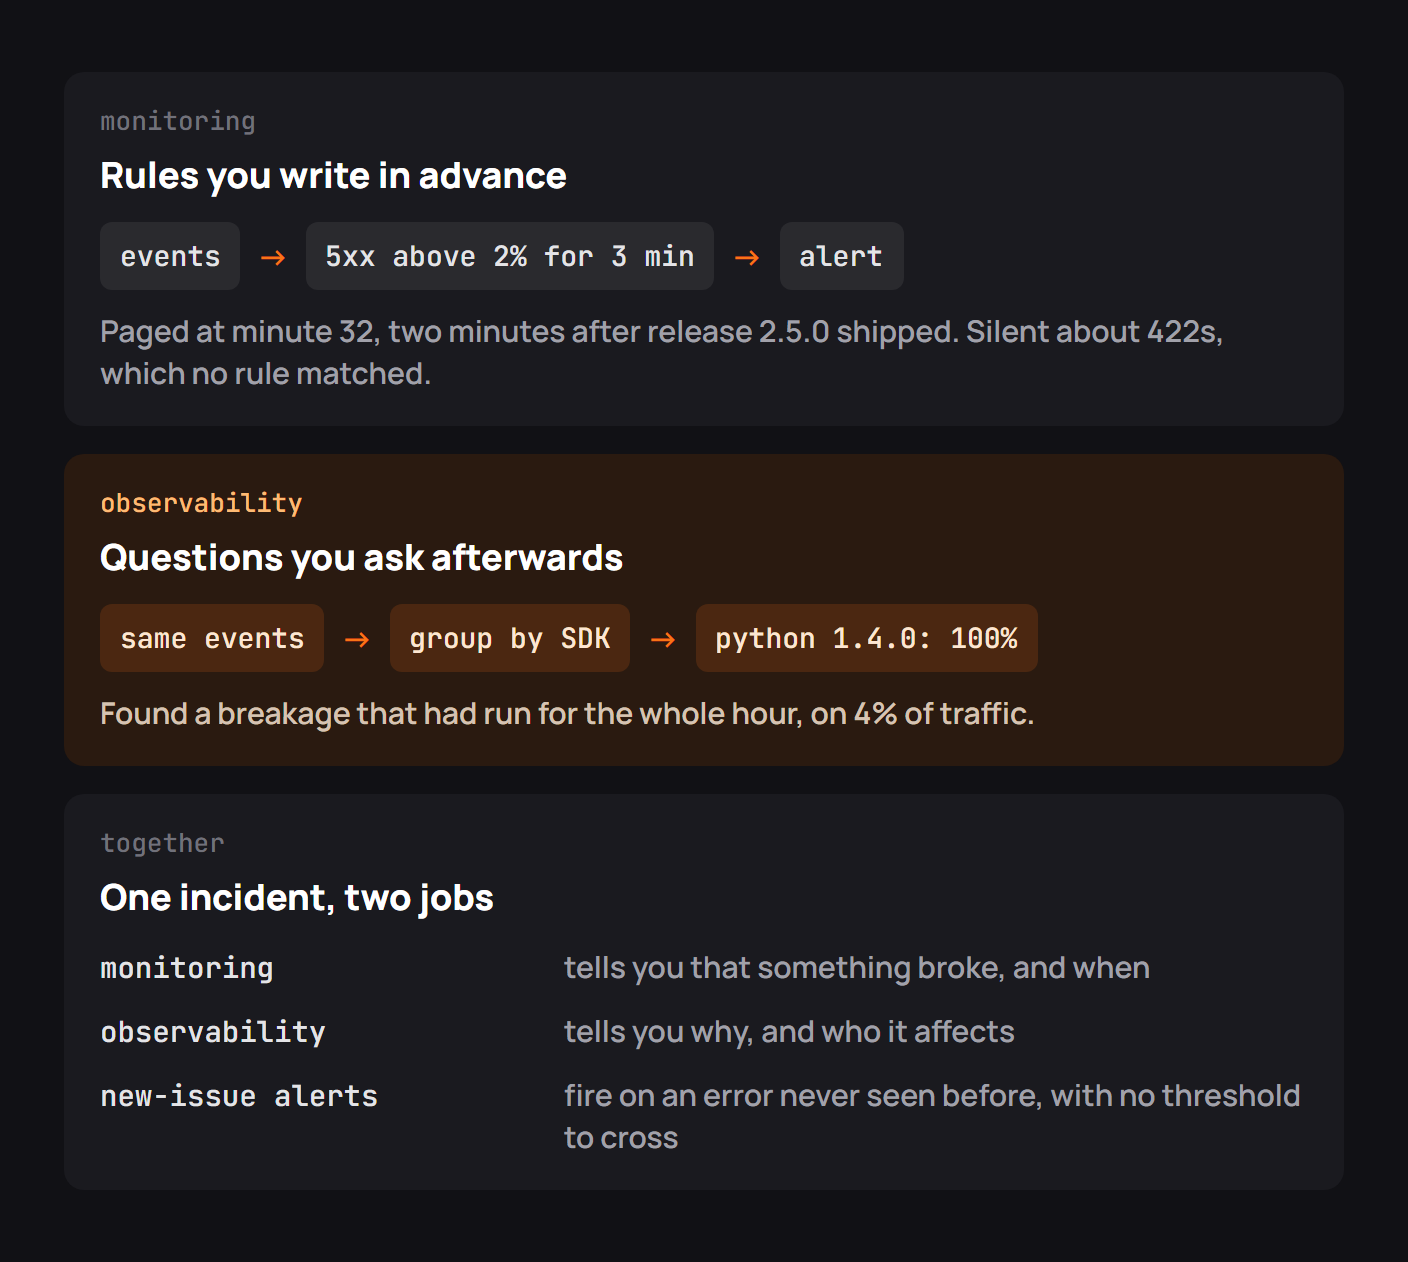
The diagram below uses a separate, illustrative orders-API incident to show the same divide at a smaller scale. A 5xx rule detects a bad release; looking at the individual events reveals a Python SDK version whose requests were failing with 422 errors before that release. It is not a reconstruction of GitHub's incident.
Why the rule missed the broken SDK
An error-rate rule aggregates what it was told to count. If it watches only 5xx, a release that changes an accepted input field can break callers with 422 while leaving the rule silent. If only 4% of traffic uses the affected SDK, a global percentage may look tolerable even when that group has a complete outage.
The answer is not to page on every 4xx. Many are ordinary invalid requests. Instead, keep enough context to ask: which operation and client version produced these new errors? Grouping by SDK release or error fingerprint can surface a problem that a broad threshold hides.
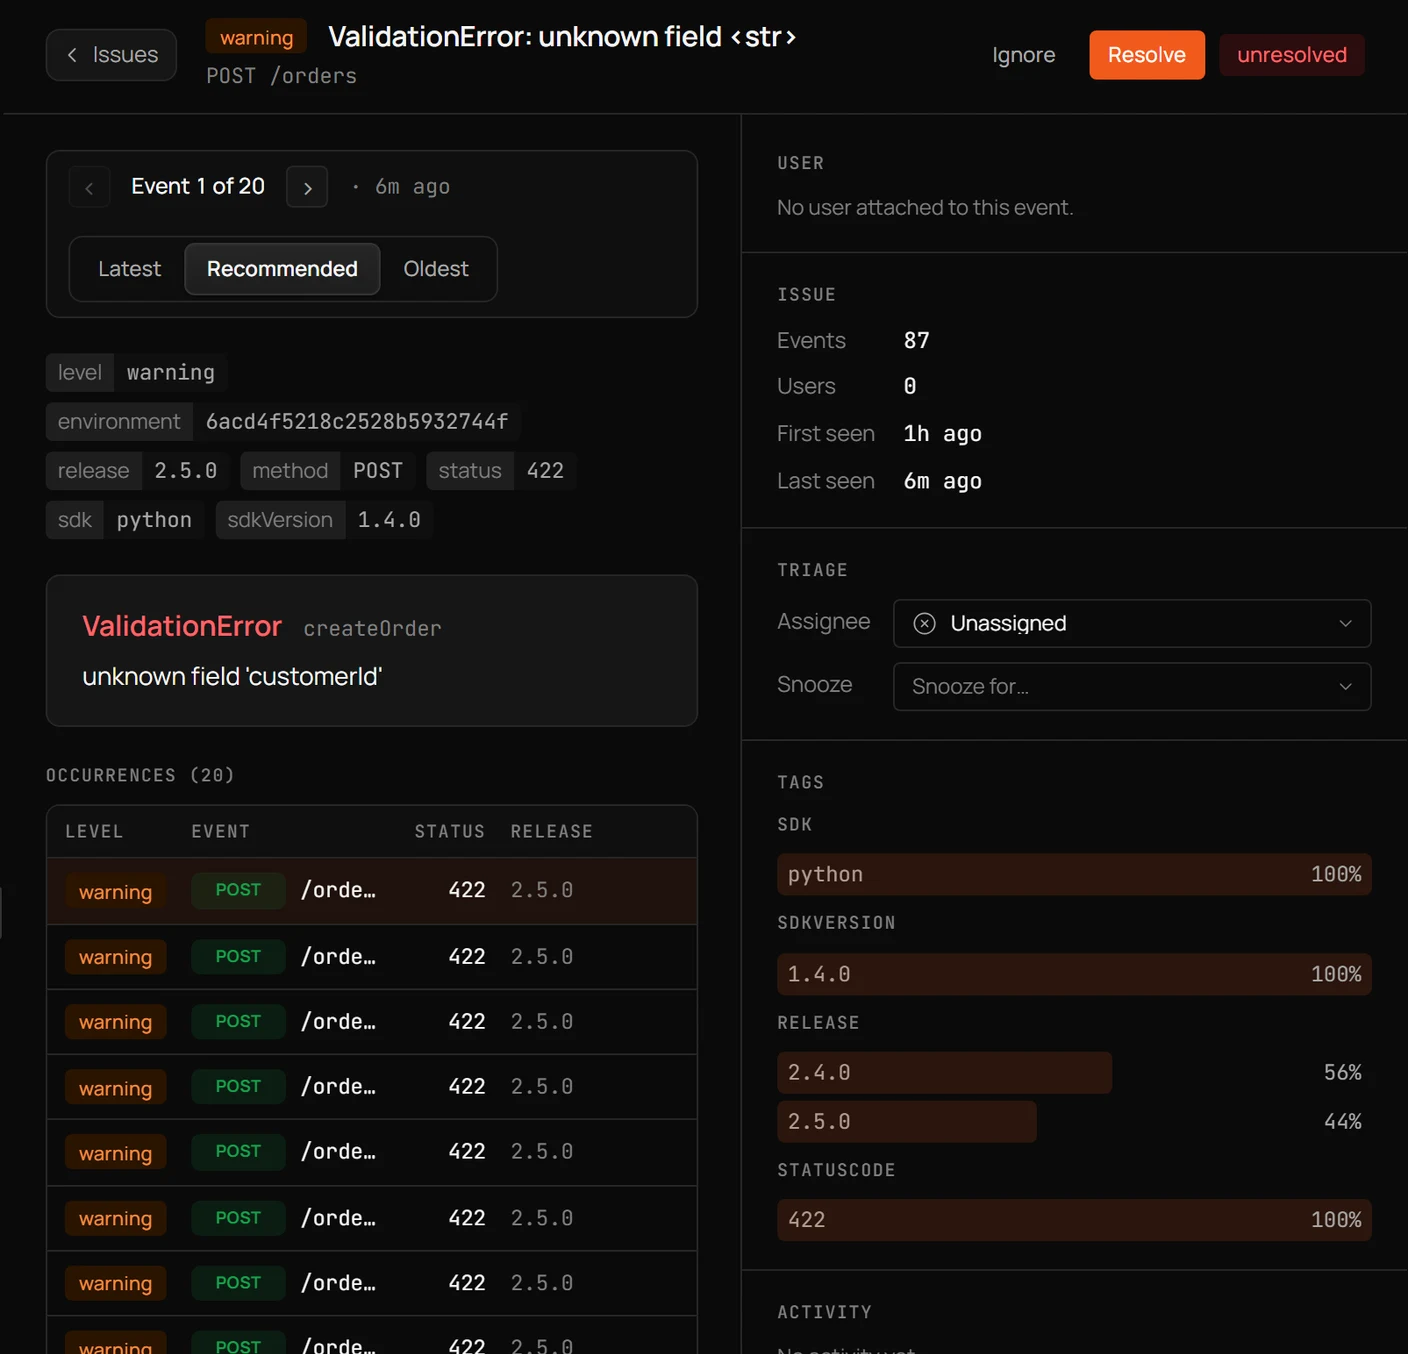
A new-error notification is another useful bridge. It cannot diagnose the cause, but it can tell the team that an unfamiliar failure began after a deployment without requiring someone to have invented a matching rule earlier.
Which one you need first
Start with monitoring if you have neither. A basic external check, 5xx rate, p95 latency, and a route to the on-call engineer are more valuable than an elaborate tracing platform nobody watches.
But add diagnostic context early. Request IDs, operation names, release identifiers, and SDK versions are cheap to record before an incident and expensive to reconstruct afterward. Once your service depends on multiple systems, distributed traces become useful because the error's HTTP status rarely identifies the failing dependency.
Choose investment based on your failure modes. A small internal API may need only a few critical checks and structured logs. A public API with many SDK versions needs both aggregate health and visibility into how different callers experience the same operation.
How they share data
Both disciplines can use the same events. One pipeline aggregates latency and errors into dashboards; another lets you query the underlying requests. A trace ID connects an event to the spans that explain its duration, while a release and SDK version help isolate regressions.
A practical flow is simple: an alert fires, the on-call engineer filters to the affected operation and time window, compares before and after a release, inspects a few errors, and opens a slow or failed trace. Then they return to the dashboard to confirm recovery across the affected population.
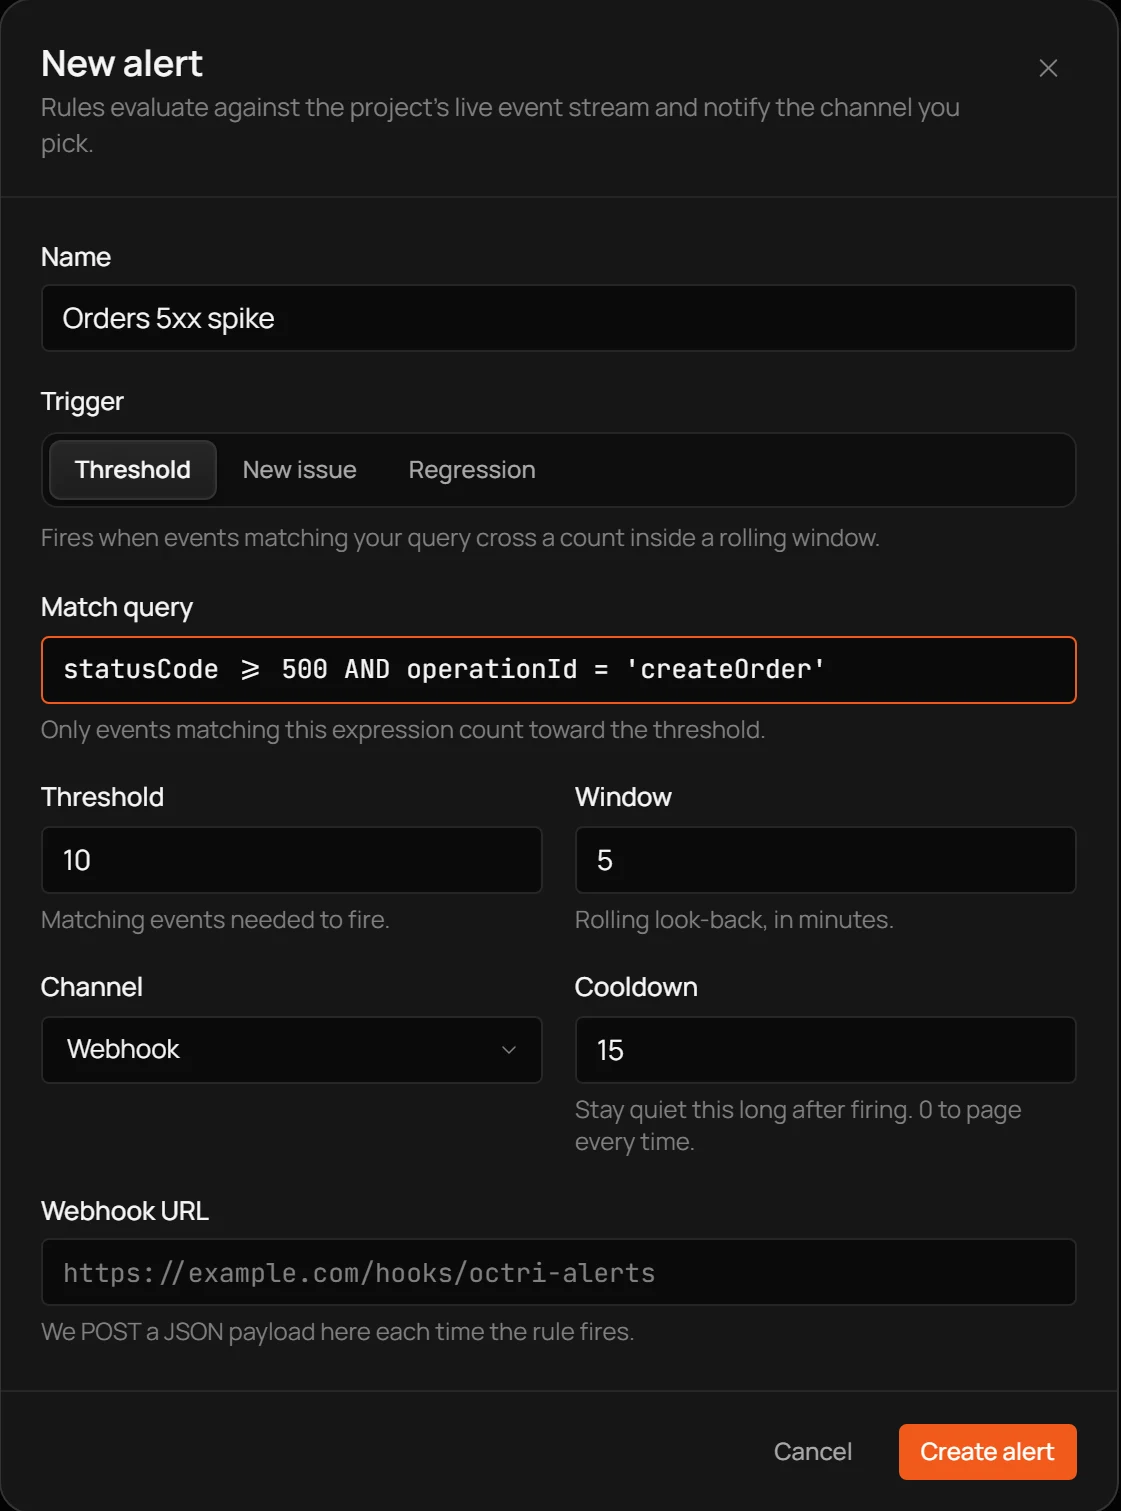
It helps to design monitoring rules around user outcomes while keeping infrastructure metrics for diagnosis. A database connection pool at 90% utilization might be urgent, or it might be normal. A significant rise in failed orders is directly meaningful. The investigation can then explain whether the connection pool is involved.
Checklist for API monitoring and observability
- Monitor availability, error rates, and tail latency on important operations.
- Make alerts actionable and tied to user impact.
- Record request and trace IDs, release, route, and relevant client metadata.
- Retain enough event detail to group unexpected failures after they occur.
- Use traces to connect a caller's symptom to the dependency that caused it.
- Split dashboards by important segments rather than trusting global averages alone.
- Turn discoveries from incidents into new rules only when those rules would have detected the problem earlier.
Monitoring and observability with Octri
Octri Monitoring combines uptime checks, alerts, searchable events, issues, and traces for an API and its SDK callers. Events from generated SDKs can carry the language, version, and method, making it possible to isolate failures that a service-wide error rate conceals. Threshold, new-issue, and regression alerts then provide ways to act on those findings.
The value is in the handoff: from a notification that calls attention to the API, to the requests and traces that explain what happened. Neither is very useful without the other when a failure crosses client and server boundaries.