Follow one API request from the customer's SDK to your database
Join request spans through context propagation. Understand retry attempts, database operations and trust boundaries without treating trace metadata as authorization.
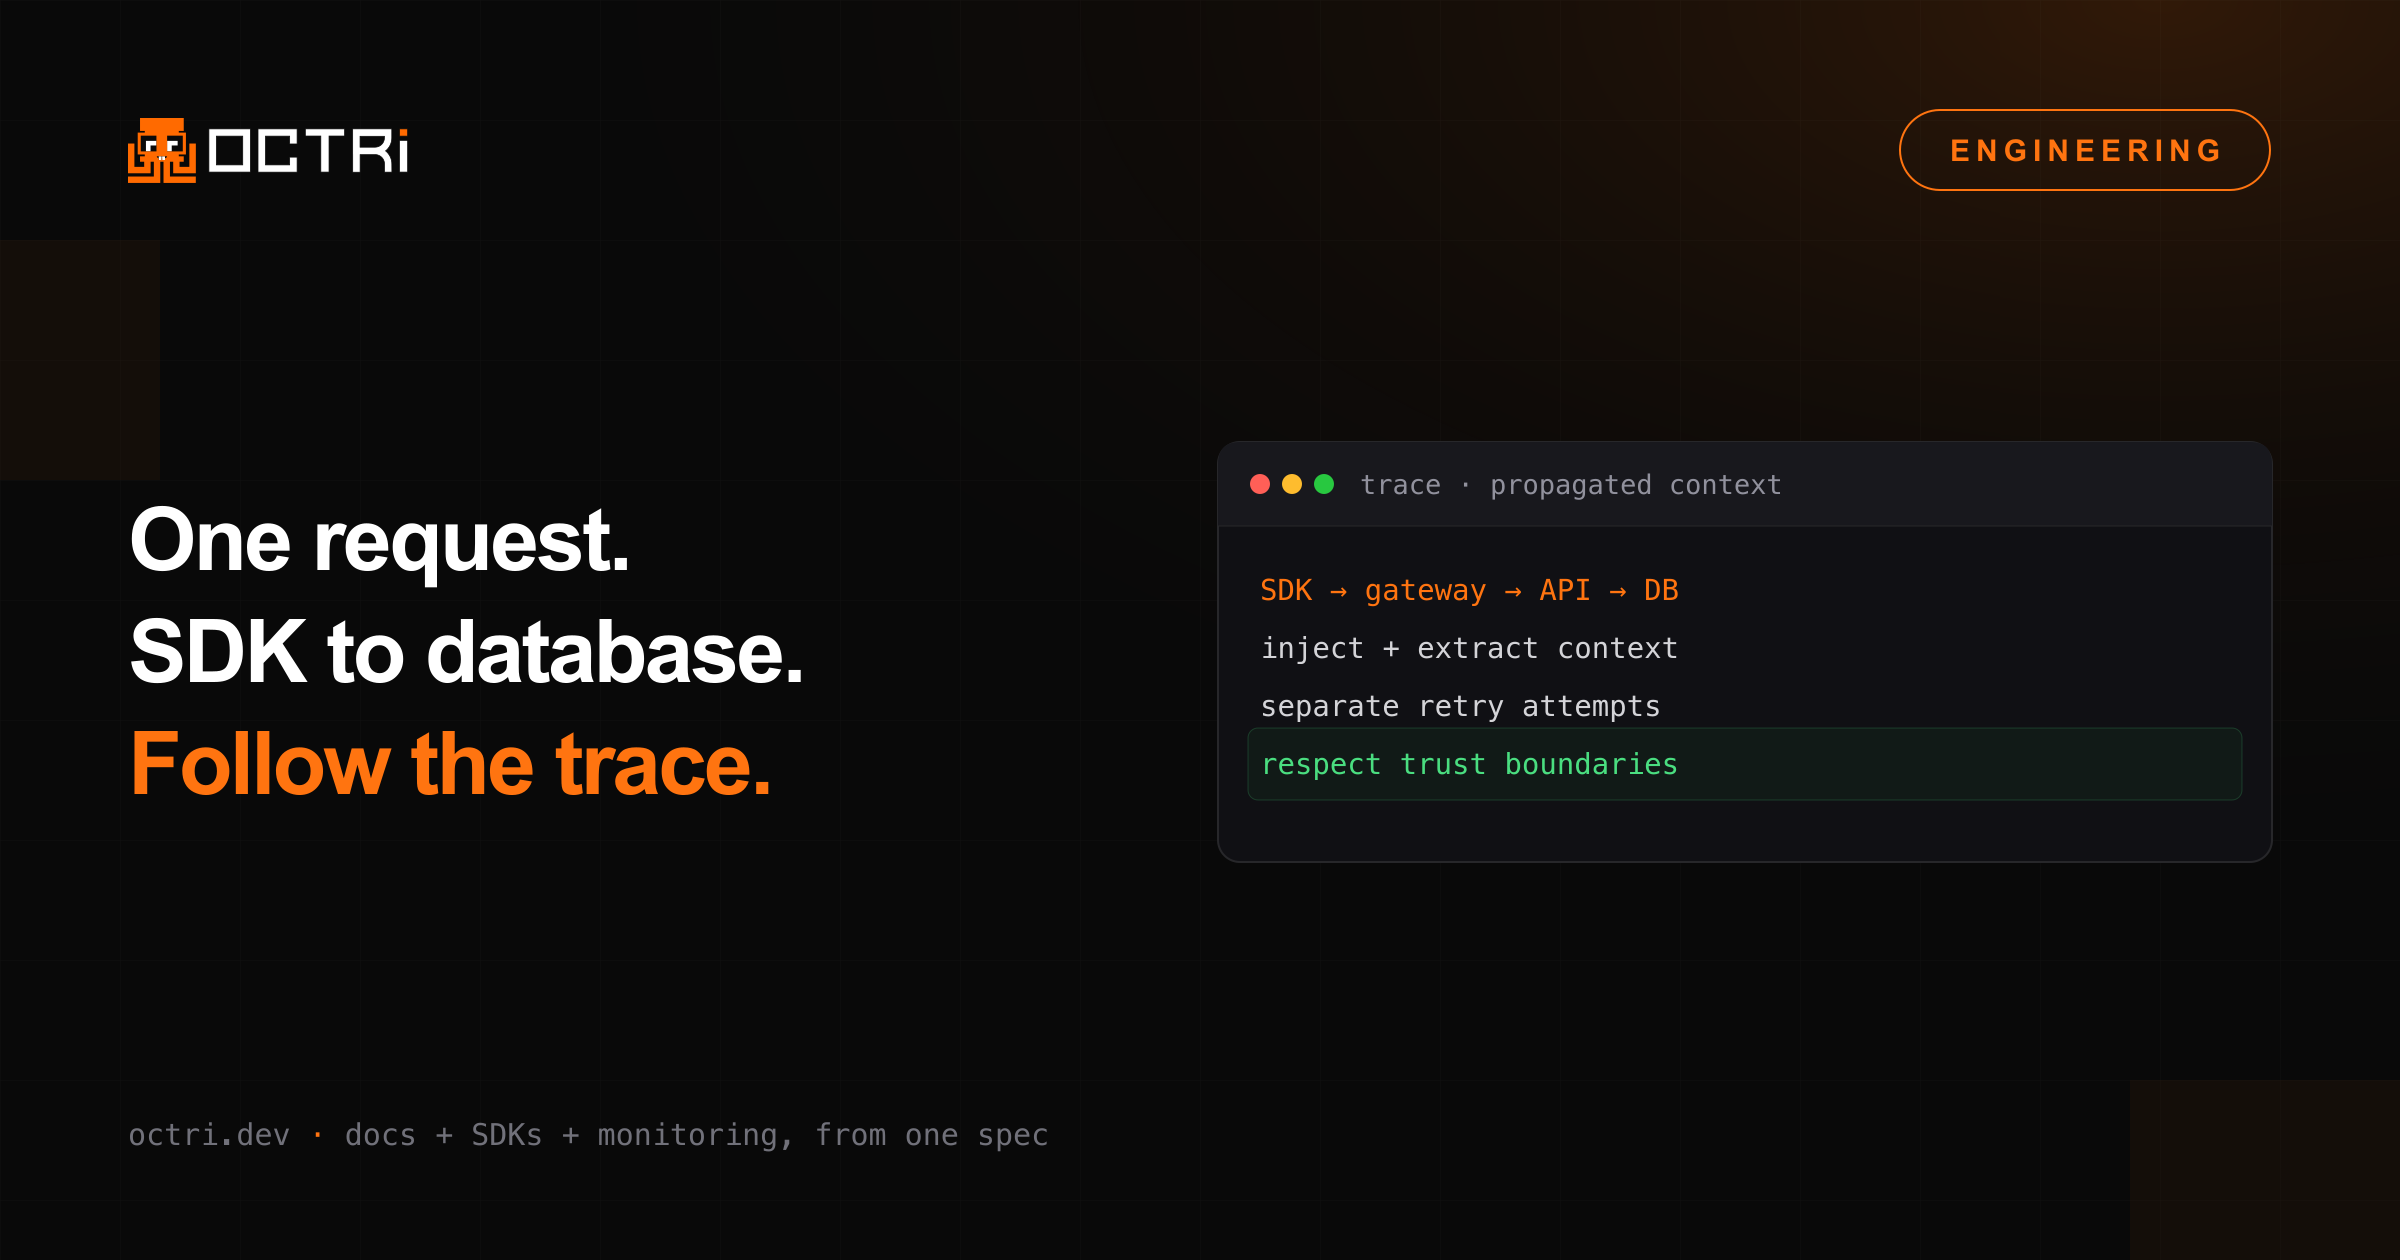
A customer reports a slow SDK call. Your handler logs show a short response time. To account for the delay, you need to see the network attempts, gateway processing and database work belonging to that call.
Distributed tracing joins those observations through propagated context. It can connect independently instrumented components when they agree to carry and interpret the same trace identifiers. It cannot reveal an uninstrumented customer process merely because your backend has tracing enabled.
Carry context across the request boundary
OpenTelemetry's propagation guide describes injecting context into a carrier and extracting it on receipt. With W3C Trace Context over HTTP, the familiar headers are traceparent and tracestate.
An instrumented SDK can inject the active context into its outgoing request. A gateway or server extracts that context and creates the appropriate receiving span. Internal work and supported database instrumentation can then appear under the server operation.
Each hop needs to preserve the relationship. If a gateway starts a new trace without an intentional linking policy, the graph splits. If a background job drops context at enqueue time, database activity may become detached from the request that scheduled it.
Distinguish logical work from attempts
A logical SDK operation may send more than one HTTP request. OpenTelemetry's HTTP span conventions recommend a client span for each physical send where the instrumentation can observe it, with resend metadata for repeated attempts.
That lets an investigator see a failed attempt, waiting time and a later success. Do not accidentally create duplicate HTTP spans by stacking equivalent instrumentation. If an application needs a larger logical operation span, give it an application-level meaning rather than another indistinguishable HTTP client span.
Database conventions differ in detail. The database span guidance describes a logical database operation, including its specified retry treatment. Apply the convention for the instrumented system instead of assuming all libraries report attempts identically.
Treat incoming context as untrusted metadata
A trace header is not proof of user identity or tenant membership. Validate it using the propagator and enforce application authorization independently. Define how public ingress handles outside trace context, sampling requests and links across trust boundaries.
Keep sensitive information out of baggage and span attributes. Context can cross several services, and baggage may propagate farther than a developer expects. A request ID or trace ID is useful for correlation; a bearer token or customer payload is not an appropriate tracing label.
If database statements are captured, review sanitization and parameter handling. OpenTelemetry does not recommend capturing database query parameters by default. Observability should help explain a request without copying its secrets into another system.
Verify continuity with a controlled request
Send one synthetic request through the deployed path. Check the SDK span where you control that process, gateway, server and database. Trigger a known retry and confirm the graph distinguishes the attempts. Then test a background handoff if the workflow includes one.
Inspect the actual spans rather than assuming a configured propagator established every relationship. Clock differences and overlapping parallel work also mean that adding all span durations is not a valid end-to-end latency calculation.