Your monitoring bill grew. Your traffic didn't
Extra metric dimensions can create far more time series without extra requests. Bound labels, understand overflow and retain the labels needed for diagnosis.
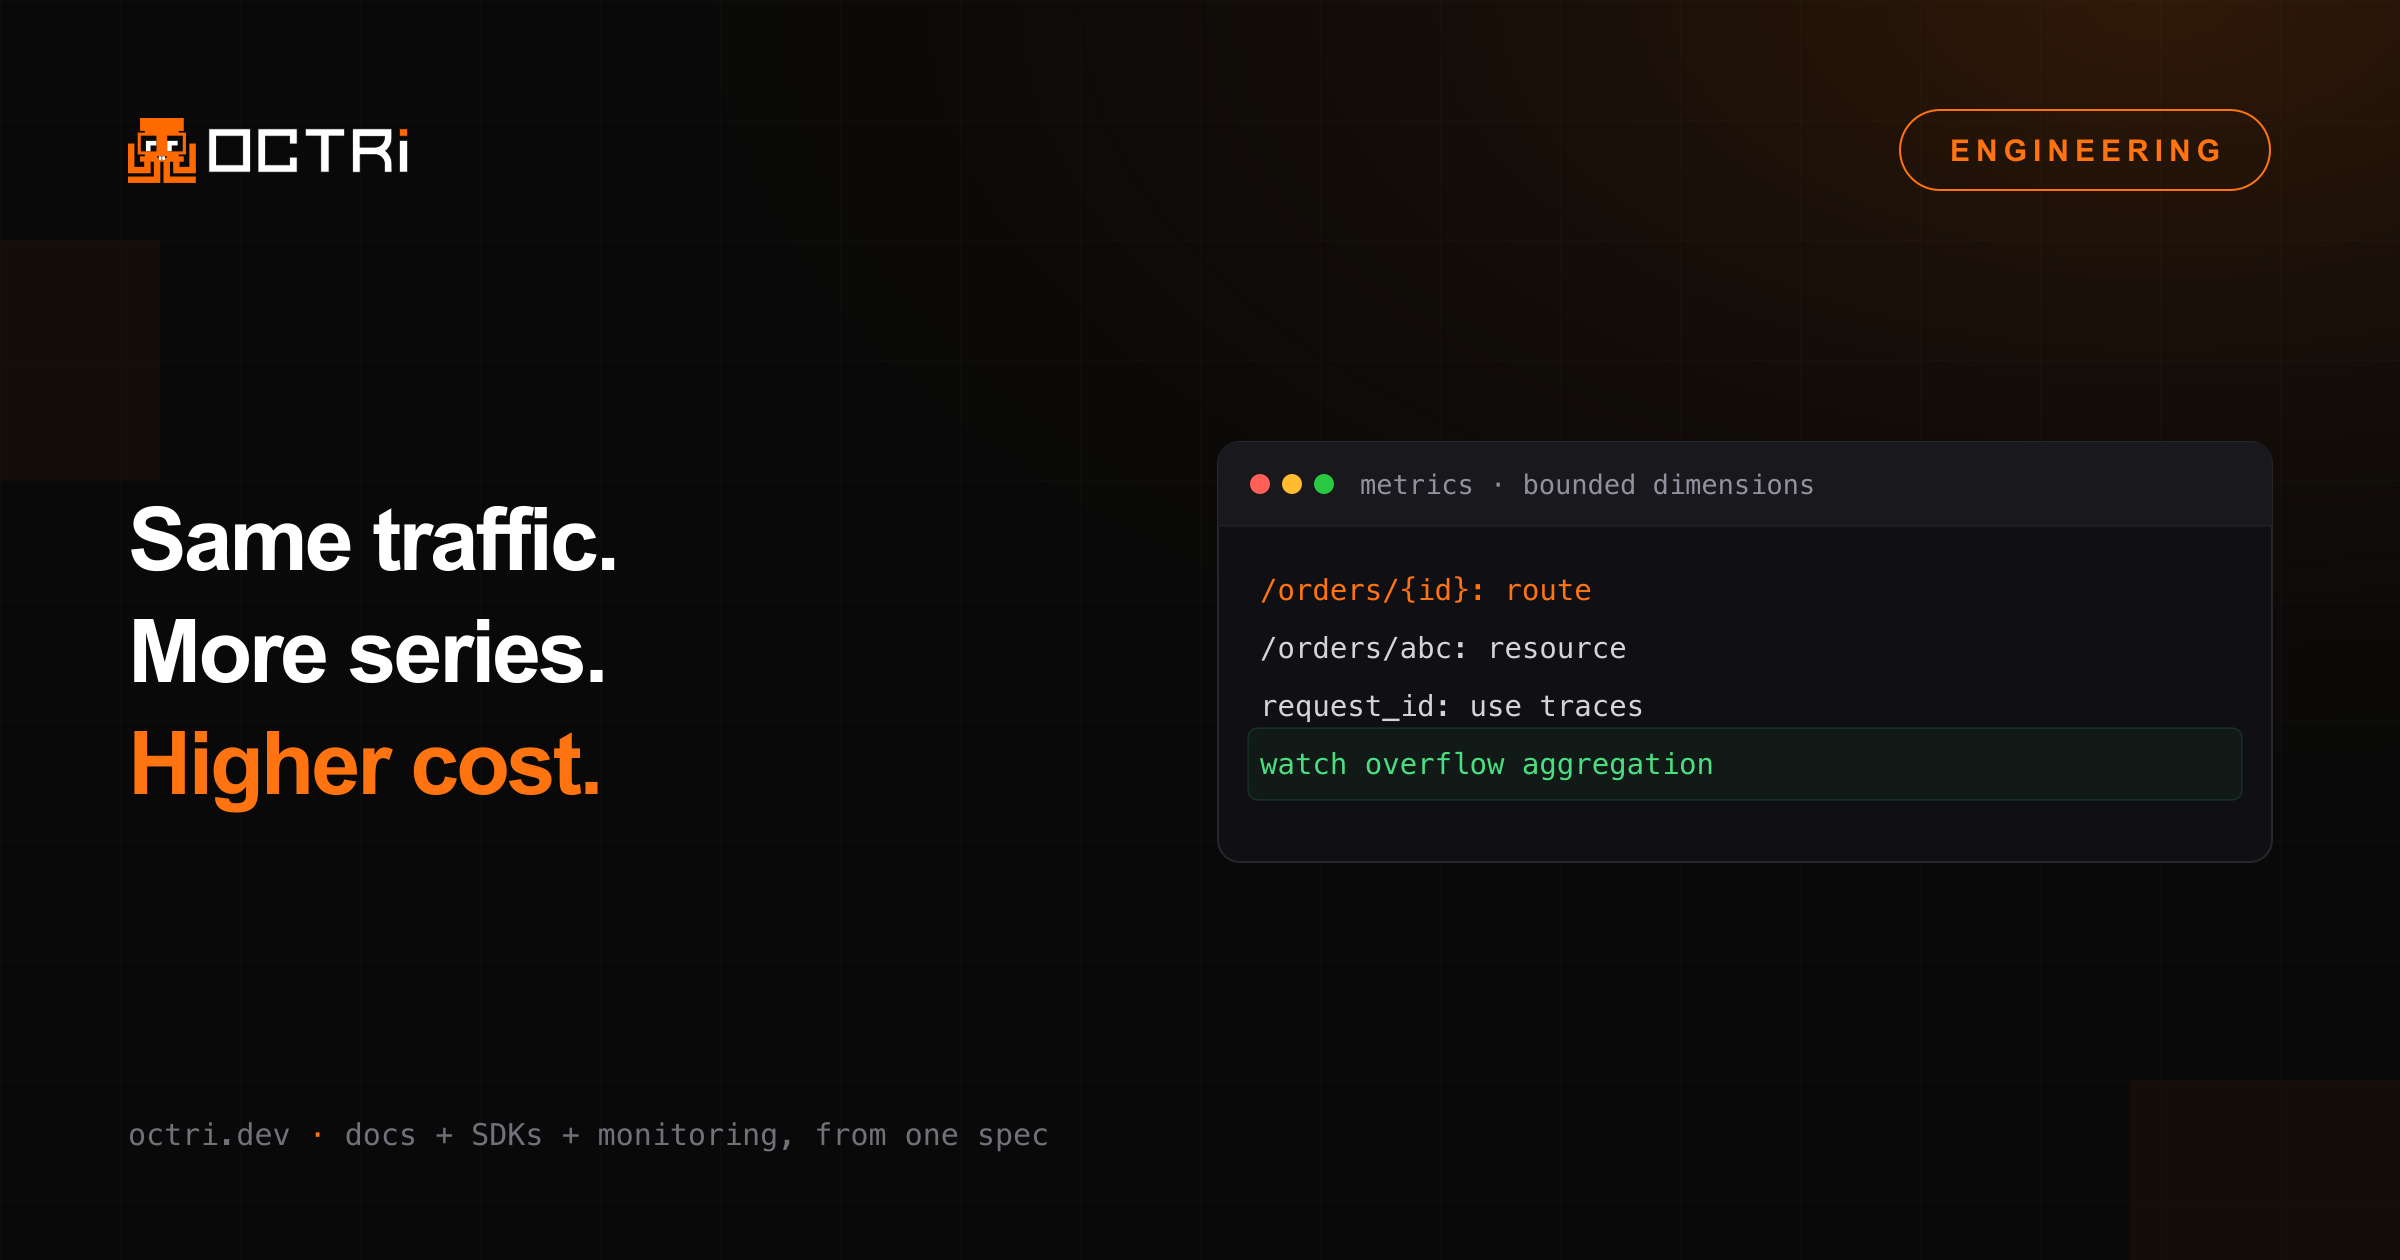
One deployment labels requests with /orders/{id}. Another labels them with /orders/abc, /orders/def and every other order path it receives. Both serve the same traffic, but the second can produce many more metric series.
Each distinct combination of metric attributes can create another series. Add customer ID, request ID and raw URL together, and the number of combinations can grow much faster than traffic. Billing depends on the backend's pricing. Check exported series and SDK memory use alongside the bill.
Model dimensions by their possible values
A bounded dimension has a controlled vocabulary: method, status class or a known route template. A per-request identifier has a potentially huge number of values. Combining dimensions multiplies possibilities, although only combinations actually observed become active.
Keep identifiers that explain individual requests in appropriately controlled logs or traces. Metrics should answer aggregate questions without requiring a unique series for every customer interaction.
Do not delete all diagnostic dimensions blindly. A useful route and outcome label may be essential for identifying a regression. Choose dimensions based on the operational questions you need to answer, and estimate their cardinality with realistic fixtures.
SDK limits protect memory, not every backend cost
The OpenTelemetry Metrics SDK specification defines cardinality limits and overflow handling. Limits apply at particular SDK metric-stream boundaries; they are not a universal cap on every series stored by your backend across processes and time.
Configuration and implementation matter. Resource attributes, collection cycles, many service instances and long retention can still produce a large backend dataset. Check the limits and aggregation behavior of the SDK and exporter versions you deploy.
When the limit is reached, overflow aggregation preserves measurements that cannot receive their own attribute set. The special overflow set uses otel.metric.overflow=true. This protects total accounting, but removes the original measurement attributes from those overflowed measurements.
An accurate total can hide an incomplete breakdown
OpenTelemetry's 2026 cardinality guide explains the consequence: a total can remain accurate while queries filtering on the original attributes undercount.
For example, filtering only success=false will not select overflow measurements that no longer carry that attribute. A dashboard can therefore miss failures in a labeled breakdown even though aggregate traffic totals remain correct.
Monitor for overflow explicitly and keep its meaning visible in operational guidance. Do not treat an overflow series as another ordinary route. It indicates that your intended dimensional view has lost detail.
Fix collection at the source
Normalize route templates, remove unbounded query strings and avoid using raw customer content as labels. Where your telemetry stack supports views or attribute filtering, configure them and inspect the exported series.
Test changes with representative traffic shapes rather than a small repeated request against one identifier. A low-volume test with one account will not reveal the cardinality of a production workload containing millions of resource IDs.
Compare active series, exported points, collector resource usage and backend ingestion after the change. Keep request volume alongside those metrics so a traffic shift does not masquerade as an instrumentation improvement.